DESTRUCTION and DEVASTATION delivered with precision. The aftermath clears the land of all the “undesirables” and makes way for their luxurious lifestyles.
Over the last 40 years I have watched the world I live in transmogrify before my very eyes. It has reached the point where I don’t even recognize it any more. There is not a single thing about this current world that is pure, honest, or real. The deception is rampant everywhere. The globalists have taken control of all media, education, and medical industry. They have run our economies into the ground in a cold and calculated manner Just like a spouse who is beat down by their abuser, the everyday people around the world are so busy fighting fires in their lives, they have nothing left. They cannot even see let alone understand what is happening around them. They have been conditioned to believe that all of this is NORMAL.
You may have seen the news coverage of what happened in Acapulco this past week. It is unbelievable. Watch the following videos so that you can appreciate that is event is so OUT OF THE NORMAL they could not even come up with an excuse or an explanation for the devastation suffered by the people of Mexico.
spacerspacer\\\
spacer
![]()
344K subscribers
spacer
![]()
858K subscribers
spacer
![]()
537K subscribers
spacer
PLEASE HELP! If you are able to send funds to help the people of Acapulco, send to:
spacer
Our weather is out of control. It started right after WWII when the began to develop the technologies to manipulate the weather. They have been developing those technologies since that time and have employed them successfully. NOW it is all about collecting data to feed into AI which will control the weather going forward.
Even if you are unwilling to believe that weather manipulation and weather control is happening right now, watch the following videos anyway. Watch them and keep in mind what you see as you move through the rest of this post. IT IS VITAL FOR YOUR FUTURE!! The elite are using the lie of CLIMATE CHANGE to drive you into oblivion. If you don’t wake up and recognize the lies for what they are you will end up losing everything, including your very soul! You may not believe you have a soul, but one day very soon, you will find out. Your eternal soul will end up either with GOD or with Satan.
The reason for this post is to give you the facts that you need to come to the realization that you have been duped. They media and the “scientists” keep denying the truth. They tell you that they are not manipulating the weather. They tell you it is not possible. Even while they use the weather as a weapon to herd you into their global web/trap/prison.
spacer
Rain Clouds Generated Mechanically Through Engine Developed by NASA
Weather modification tech: How cloud seeding increases rainfall
Hacking The Planet: Making it Rain with a Laser
spacer
![]()
18.5K subscribers
spacer
How DUBAI Actually Controls its Weather
Dubai artificially creating rainstorms with drones and electricity
spacer
In this next section, I have pulled together a sampling of articles and videos that should give you an idea of how long they have been using weather control technology and how it has developed over the years. Once you grasp the truth of what can be done you can recognize that the weather disasters that have been destroying lives, economies and the landscape for the last 40 years have not been naturally occurring. Neither have the been due to what has been referred to as “Globally COOLING”, “Global Warming” or “CLIMATE CHANGE”. They have nothing to do with CO2, animal farts, or greedy humans. ‘
This has occurred over decades as part of a very carefully planned and executed AGENDA for world dominance.

The April 3 flight from California’s Barstow/Daggett Airport reached an altitude of 37 kilometers (121,000 feet) and took measurements as part of a program established to correlate data with the Upper Atmosphere Research Satellite (UARS).
The data from the balloon flight will also be compared to readings from the Atmospheric Trace Molecular Spectroscopy (ATMOS) experiment which is currently flying onboard the shuttle Discovery.
“We launch these balloons several times a year as part of an ongoing ozone research program. In fact, JPL is actively involved in the study of ozone and the atmosphere in three important ways,” said Dr. Jim Margitan, principal investigator on the balloon research campaign.
“There are two JPL instruments on the UARS satellite,” he continued. “The ATMOS experiment is conducted by JPL scientists, and the JPL balloon research provides collaborative ground truth for those activities, as well as data that is useful in its own right.“
The measurements taken by the balloon payload will add more pieces to the complex puzzle of the atmosphere, specifically the mid-latitude stratosphere during winter and spring. Understanding the chemistry occurring in this region helps scientists construct more accurate computer models which are instrumental in predicting future ozone conditions.
The scientific balloon payload consisted of three JPL instruments: an ultraviolet ozone photometer which measures ozone as the balloon ascends and descends through the atmosphere; a submillimeterwave limb sounder which looks at microwave radiation emitted by molecules in the atmosphere; and a Fourier transform infrared interferometer which monitors how the atmosphere absorbs sunlight.
Launch occurred at about noontime, and following a three hour ascent, the balloon floated eastward at approximately 130 kilometers per hour (70 knots). Data was radioed to ground stations and recorded onboard. The flight ended at 10 p.m. Pacific time in eastern New Mexico when the payload was commanded to separate from the balloon.
“We needed to fly through sunset to make the infrared measurements,” Margitan explained, “and we also needed to fly in darkness to watch how quickly some of the molecules disappear.”
It will be several weeks before scientists will have the completed results of their experiments. They will then forward their data to the UARS central data facility at the Goddard Space Flight Center in Greenbelt, Maryland for use by the UARS scientists.
The balloon was launched by the National Scientific Balloon Facility, normally based in Palestine, Tex., operating under a contract from NASA’s Wallops Flight Facility. The balloon was launched in California because of the west-to-east wind direction and the desire to keep the operation in the southwest.
The balloons are made of 20-micron (0.8 mil, or less than one-thousandth of an inch) thick plastic, and are 790,000 cubic meters (28 million cubic feet) in volume when fully inflated with helium (120 meters (400 feet) in diameter). The balloons weigh between 1,300 and 1,800 kilograms (3,000 and 4,000 pounds). The scientific payload weighs about 1,300 kilograms (3,000) pounds and is 1.8 meters (six feet) square by 4.6 meters (15 feet) high.
The JPL balloon research is sponsored by NASA’s Upper Atmosphere Research Program and the UARS Correlative Measurements Program.
spacer
 THE COMING MEGAFLOODS

ST. LOUIS, MISSOURI — There’s something unusual going on in the skies over St. Louis in the U.S. Midwestern state of Missouri. Students at Saint Louis University are launching weather balloons as part of a nationwide study funded by the U.S. space agency NASA, aimed at improving our understanding of air pollution and global climate.
A small group of Saint Louis University students are huddled around a laptop and radio receiver set up outside the Saint Louis Science Center planetarium. They’re getting ready to participate in the NASA mission to measure ozone ― a gas that both protects and pollutes the planet.
Inside a small Styrofoam box are a GPS, and two little instruments that measure temperature, humidity, air pressure and ozone. A transmitter in the box broadcasts the data to a 2-meter-tall antenna connected to that beeping radio receiver. From there, an old-school modem translates the audio signal into ones and zeroes that the laptop converts into air quality measurements.
Once the students have checked that all the equipment is working, the next step is to attach the Styrofoam box with its instruments to a weather balloon that will carry everything up into the atmosphere.
Once it is filled the helium, the balloon is 2 to 3 meters in diameter. The goal is to give it enough lift to carry its cargo up about 30 kilometers into the stratosphere. That’s around three times as high as commercial jets fly.
Gary Morris, a professor at Valparaiso University in Indiana and the lead trainer for the NASA ozone balloon project, is overseeing the launch. St. Louis is one of seven sites, from Colorado to Florida, involved in the nationwide study. Morris says NASA wants to get more data on ozone because of the important roles it plays in our atmosphere ― both good and bad.
High up in the stratosphere, the ozone layer absorbs sunlight and keeps harmful ultraviolet radiation from reaching the earth.
But down near the ground, emissions from sources like petrochemical plants and cars can form ozone pollution and smog, which can exacerbate respiratory problems like asthma.
“It’s especially difficult on children who are still developing,” Morris said. “So children who grow up in areas that are chronically exposed to high levels of ozone have more frequent rates of asthma.”
Saint Louis University’s ozone study is being led by Jack Fishman, who worked for NASA for more than 30 years, studying air pollution and atmospheric chemistry.
He says while regulations have led to lower ozone pollution in urban areas of the U.S., ozone levels outside of cities have continued to rise.
“A lot of it has to do with the increased anthropogenic activity, industrial activity in eastern Asia,” Fishman said.
He says that’s because pollution is being blown across the Pacific by global air currents in the upper atmosphere.
“So we’ve crossed the threshold of increasing ozone concentrations whereby we actually see enough ozone, in the atmosphere, that crop growth is inhibited, forest growth is being impeded.”
In 2010, Fishman published a study showing that ozone damage to the U.S. soybean crop alone may cost farmers hundreds of millions of dollars each year.
And he says that, like carbon dioxide, ozone absorbs heat and affects climate.
“So this project is trying to understand the complexity of the chemistry and the clouds and other processes, meteorological processes, that impact local meteorology,” Fishman said, “which in turn form the big picture of climate…and in turn climate change.”
Back at the Saint Louis Science Center, the balloon and its payload swoop upwards. Saint Louis University senior William Iwasko is one of four undergraduates on the launch team. He says launching the weather balloons by the planetarium, in a public park, gives kids who come by a chance to see science in action.
“And it helps to build their excitement for science and especially meteorology, so we hope we’re developing little meteorologists here,” Iwasko said.
Zack Crawford, 7, says when he grows up, he wants to be…a fireman. But the balloon launch definitely made an impression.
“That was amazing,” Zack said. “It’s so high that I can’t even see it.”
The ozone balloon project runs through the end of September.
CHASING AEROSOLS AND ATMOSPHERIC RIVERS
ARM Cloud Aerosol Precipitation Experiment (ACAPEX) sets sail and takes flight

An atmospheric river branches off an equatorial storm, stretching from Hawaii to the U.S. West Coast, transporting as much moisture as 10-20 times the flow in the Mississippi River.
What if you could better prepare for a drought or flood? Researchers are hoping to find more answers during a new field campaign—ARM Cloud Aerosol Precipitation Experiment (ACAPEX)—sponsored by the Department of Energy (DOE) Office of Science. As mentioned in a recent Nature article, this campaign is the biggest push to date to understand the phenomena of atmospheric rivers—long and concentrated bands of water vapor originating from the tropics that often result in extreme precipitation and flooding when they hit land—which have received serious scientific attention in the past decade. ACAPEX aims to improve the understanding and modeling of cloud and precipitation processes associated with atmospheric rivers and aerosol-cloud interactions that have important effects on precipitation. Over the next six weeks during ACAPEX, DOE’s second ARM mobile facility (AMF2) and ARM Aerial Facility (AAF) will be collecting data to improve computer models that predict extreme events in a changing climate. Collaborating with the National Oceanic and Atmospheric Administration (NOAA) field campaign called CalWater2, ACAPEX includes instruments on a NOAA ship traversing the Pacific Ocean in search of atmospheric rivers and on a DOE-sponsored plane flying into clouds over land and sea.
“We are collecting these data to improve computer models of rain that represent many complex processes and their interactions with the environment,” said Pacific Northwest National Laboratory’s Ruby Leung, lead scientist for ACAPEX. “Atmospheric rivers contribute most of the heavy rains along the coast and mountains in the West. We want to capture those events better in our climate models used to project changes in extreme events in the future.”
In a typical winter, a few atmospheric rivers account for 30-50% of the annual perception in California. With more accurate modeling of atmospheric rivers, scientists can improve understanding and predictions of climate changes that affect specific regions of the globe. Researchers are looking for new insights into how precipitation processes associated with atmospheric rivers can also be influenced by different sources of aerosols particles.
Storm Chasing-West Coast Style

The team will be at the mercy of the weather during the next few weeks. When an atmospheric river forms, researchers will sail the research ship to follow it and collect data. Four aircraft—the NOAA WP-3D and G-IV, the National Aeronautics and Space Administration (NASA) ER-2, and the DOE-sponsored Gulfstream-1 (G-1)—will also be launched and coordinated to collect data through the clouds at various elevations by flying in stacked formations.
NOAA’s research vessel Ronald H. Brown was launched in the Pacific Ocean on January 15, 2015, with the AMF2 installed on board. The G-1, operated by the ARM Aerial Facility, also took its first liftoff out of Sacramento, California, where it is making routine flights over the Sierra Nevada Mountains and coastal California and over the AMF2 on the Ron Brown as it nears San Francisco and Bodega Bay, California.
“The G-1 already completed three research flights out of McClellan, California, with one exciting flight on January 20 that was coordinated with the NASA ER-2, ” said Beat Schmid, ARM Aerial Facility Technical Director. “There are sure to be interesting data from these three flights.”For more information, see the Scripps’ press release and PNNL’s press release.
spacer

When California gets a big storm, it likely started in the tropics a week before. The narrow corridors of water vapor are called atmospheric rivers, or AR’s. Get too many, California gets floods; too few, drought. Scientists have also discovered AR’s (Atmospheric Rivers) need to hold little particles called aerosols. (So, without all the aerosols that scientists have been forcing into our atmosphere, Atmospheric Rivers would not be suddenly so prolific!)
“If they don’t have the little particles in the air for the cloud droplets to initially grow on, or to take the cloud drops and turn them into ice, all that water vapor – much of it is going to go right past us and we’re not going to receive the benefit of that,” says Marty Ralph with the Scripps Institution of Oceanography at UC San Diego.

(Instruments on plane wing of NOAA aircraft are able to sample water vapor. Amy Quinton / Capital Public Radio)
A research project, called “CalWater 2015,” will study those little particles in atmospheric rivers and how they influence precipitation. Ralph, along with scientists from the National Oceanic and Atmospheric Administration, the Pacific Northwest National Lab, and NASA will gather that data from aircraft, ships, and ground stations as atmospheric rivers strike the West Coast. The next AR is this week.
“We’re going fly tomorrow with the NOAA G4 and it’s going to sample the river well off shore, and then on Friday the atmospheric river is going to pass over where we have the ship parked,” says Allen White, a research meteorologist with NOAA. “So we’ll take advantage of that to fly all of our aircraft above the ship so we get a full three-dimensional picture of the atmospheric river as it passes over the ship, which has never been done before. That’s really cool.”

(Lasers are used to capture water vapor samples to understand atmospheric rivers. Amy Quinton / Capital Public Radio)
The project is designed to improve the ability to forecast the arrival, intensity and strength of precipitation over water and land. Understanding the atmospheric rivers can help improve flood and drought management in California and throughout the west.
spacer
![]()
Scientists go high and low for data on drought-fighting ‘sky rivers’
SACRAMENTO — Finally, it had arrived: the long band of atmospheric water vapor from the tropics that scientists were eager to examine from every conceivable angle.
“This is the big blockbuster event,” Cmdr. Mark Sweeney said shortly before he guided a federal research plane named Miss Piggy into a puffy, pewter-colored blanket of clouds that spread across Northern California.
The P-3 Orion aircraft was part of an unprecedented research effort that sampled and measured two atmospheric river storms that gave half the state a welcome soaking a week ago. Four planes, a ship, ground equipment and even space satellites collected a mountain of data as the sky rivers rolled in from the Pacific Ocean.
Atmospheric rivers form all over the globe. But there has been growing interest in the West Coast storms as scientists recognize the vital role they play in the yo-yo water supply of the nation’s most populous state. Their presence or absence can break or make a drought. Knowing when and where they will arrive and how much rain and snow they are likely to dump is crucial information for water managers.
A strong sky river can carry a load of water vapor equivalent to more than 10 times the flow of the lower Mississippi River. When the ribbons of moisture slam into California’s coastal ranges and the Sierra Nevada, they rise and condense into rain and snow, delivering on average 40% of the state’s annual precipitation. Atmospheric rivers have ended roughly a third or more of state droughts since the middle of the last century, according to a recent study.
The pair of storms that barreled into Northern California over the course of four days weren’t big enough to bust the current prolonged drought. But they dumped as much as 15 inches of rain on the mountains of Shasta County. After a parched January, they pushed precipitation totals back to normal levels for this time of year in the northern watersheds that supply some of the state’s most important reservoirs.
Miss Piggy, a federal “Hurricane Hunter” plane loaded with sophisticated meteorological instruments bolted to the floor, took off from McClellan Airfield at 7 a.m., just as the pastel colors of the rising sun were being swallowed by the gray clouds of the advancing storm front.
On board were four research scientists and the blue-suited flight crew from the National Oceanic and Atmospheric Administration. For the next seven hours they would fly through, under and above the sky river, traveling roughly 2,000 bumpy miles back and forth over the Pacific Ocean, the Coast Range and the Sacramento Valley.
All the while, radar equipment mounted on the aircraft’s exterior measured precipitation and cloud thickness. Probes attached to the wings measured the number and size of liquid cloud droplets. Another of the plane’s radar devices measured the height of ocean waves.
At various points over the Pacific, the NOAA crew loaded two types of disposable instruments into a chute and released them with a whoosh from Miss Piggy’s belly.
Dropsondes, compact cylinders outfitted with sensors that transmit data back to the plane in real time, measured temperature, atmospheric pressure, humidity and winds as they parachuted 8,000 feet to the white-capped sea.
Larger cylinders called airborne expendable bathythermographs, or AXBTs, opened up when they hit the water, unfurling probes that transmitted the temperature at the ocean surface and more than 1,000 feet below it.
All that was just one part of the scientific attack mounted that day. “This is an unprecedented interrogation of an atmospheric river event in landfall,” said Ryan Spackman, an atmospheric chemist and NOAA contractor from Boulder, Colo., who was the lead researcher on the flight.
Three other federal research planes were also in the air. One sampled the composition of atmospheric aerosols, tiny particles at the center of every cloud droplet. The other two aircraft recorded conditions at higher altitudes than Miss Piggy, which mostly flew through the river’s core.
On the Pacific, a NOAA research vessel, the Ronald H. Brown, collected weather and ocean data about 230 miles offshore. A space satellite measured surface winds over the sea, and the International Space Station focused a laser beam on the clouds to discern how dust aerosols were mixing over the ocean. Meanwhile, a ground-based network of instruments sampled conditions at various locations.
Scientists involved in the effort say no atmospheric river in history has been as thoroughly poked, dissected and analyzed as the one that hit Northern California on Feb. 6.
The view didn’t change much as Sweeney directed Miss Piggy along a rectangular fight path that started over the Pacific west of the Bay Area and then shot inland to the northeast. Rivulets of water slid across the portals as the plane cut though pale clouds, flying alternately at 8,000 and 10,000 feet above the soggy landscape.
For one long stretch over the ocean, Sweeney spiraled down to 1,000 feet, bringing the swells of the dark, choppy Pacific into view.
For the researchers monitoring instruments on board, riding the river as it made landfall was a thrill of their careers. “Flying the dream,” Spackman wrote in a message to other mission scientists.
The complex choreography of research craft was years in the making — part of an ongoing federal-state project called CalWater that is studying atmospheric rivers and the role that aerosols play in California’s snow and rainfall. The first phase ran from 2009 to 2011. The second phase was launched last year and will extend to 2018.
This year’s field campaign, which began in January and will end in March, is costing roughly $10 million, most of it provided by the federal government.
Scientists from NOAA, the Department of Energy, NASA, Scripps Institution of Oceanography at UC San Diego, the state Department of Water Resources and other agencies are trying to better understand how atmospheric rivers evolve as they encounter the state’s up-and-down topography. They are also researching how the composition of aerosols, which can be natural or man-made, influences the amount of rain and snow that clouds release.
The rich array of data being collected “will give us all the pieces of the puzzle to really start to take our understanding of things to the next level,” said project co-leader Kim Prather, a Scripps scientist who is studying aerosols this winter at a Bodega Bay site.
The researchers hope to improve forecasting that can help California water managers plan for big storms that could cause flooding or suddenly swell reservoirs. They hope to also better understand how climate change will affect atmospheric rivers and the state’s water supply.
Shortly after 2 p.m., Miss Piggy landed at McClellan in a steady rain. Spackman was smiling as the flight crew and researchers gathered for a short debriefing before walking down the stairs onto the wet runway.
“We made history,” he said.
spacer
![]()
| Eos Etymology. From Ancient Greek Ἠώς (Ēṓs, “Greek goddess of the dawn”), from ἠώς (ēṓs, “dawn, daybreak; morning; day; east”). Doublet of Aurora. |
Setting the Stage for a Global Science of Atmospheric Rivers

Flooded homes along the Russian River in California. National Oceanic and Atmospheric Administration scientists and colleagues installed the first of four permanent “atmospheric river observatories” in California in December 2012 to better monitor and predict the effects of powerful winter storms associated with atmospheric rivers. Credit: FEMA
Atmospheric rivers are important mechanisms for transporting water vapor through the atmosphere outside the tropics. These long, narrow, transient corridors occur at low altitudes just ahead of the cold front in midlatitude cyclone systems. These rivers in the sky stitch together the components of the extratropical water cycle by providing large-scale horizontal water vapor transport.
Scientists’ understanding of the evolution, characteristics, geographic distribution, and hydrologic impacts of atmospheric rivers (ARs) in western North America, South America, and Europe has grown explosively in recent years. In June, experts from around the world met in La Jolla, Calif., to survey the state of atmospheric river science.
A highlight of the workshop was discussions of the relationships among ARs, warm conveyor belts (WCBs), and tropical moisture exports (TMEs). These components of large-scale water vapor transport have been the focus of recent studies in North America, Andean South America, and western Europe, but the studies vary in focus and often do not integrate information on all three components. By drawing together specialists on each component, workshop participants were able to clarify the distinct and complementary roles the three elements play in vapor transport outside the tropics.
The group reached consensus on definitions of each component. Specifically, the WCB refers to the zone of dynamically uplifted heat and vapor transport close to a midlatitude cyclone. The vapor is often transported to the WCB by an AR, and the result of the uplift is heavy rainout that generally marks the downwind end of AR conditions if the AR hasn’t experienced orographic uplift (upslope flow) and rainout over mountains earlier along its approach to the WCB.
TMEs are zones of intense vapor transport out of the tropics, vapor that is frequently conducted by ARs toward cyclones and WCBs. TMEs can provide important vapor sources for ARs, but most ARs also incorporate midlatitude sources and convergences of vapor along their paths.

Fig. 1. This depiction of an atmospheric river, interacting with West Coast mountains and a midlatitude cyclone over the northeast Pacific on 5 February 2015, provides an example of approximate locations of associated tropical moisture exports and a warm conveyor belt (WCB). Credit: Adapted from NOAA/ESRL Physical Sciences Division
Participants discussed how ARs can be the pathways that connect TMEs to WCBs or orographically induced rainouts (Figure 1). However, ARs, TMEs, and WCBs also can form separately and without direct connections to each other. This taxonomy will emerge more fully in peer-reviewed literature as participants pursue collaborations initiated at the workshop.

Plans were made for special sessions A33I and A53F at the 2015 American Geophysical Union Fall Meeting and for the first International Atmospheric Rivers Conference, to be held in summer 2016 at Scripps Institution of Oceanography. The conference will be open to scientists from around the world with the aim of continuing collaboration on the breakthroughs that are rapidly emerging in this field.
The workshop was sponsored by the U.S. Geological Survey and the Center for Western Weather and Water Extremes at the Scripps Institution of Oceanography.
—Michael Dettinger, U.S. Geological Survey National Research Program, Carson City, Nev.; email: mddettin@usgs.gov; and F. Martin Ralph and David Lavers, Center for Western Weather and Water Extremes, Scripps Institution of Oceanography, La Jolla, Calif.
Citation: Dettinger, M., F. M. Ralph, and D. Lavers (2015), Setting the stage for a global science of atmospheric rivers, Eos, 96, doi:10.1029/2015EO038675. Published on 3 November 2015.

spacer


![]()
WASHINGTON — To help solve the problem of California’s long-running drought, NOAA scientist Chris Fairall of Colorado took a trip last month to one of the wettest places he could find: a ferocious winter storm about 800 miles west of San Francisco.
There, for five straight days, Fairall and the rest of the research team aboard the ship Ronald H. Brown were rocked by 18-foot waves, 35-knot winds and the relentless roll that comes with an angry Pacific Ocean.
GRAPHIC: Looking for the “river in the sky”. Click to view full-size.
“You couldn’t stand up without having an arm holding on to something,” said Fairall, who works for the National Oceanic and Atmospheric Administration in Boulder. “On the really rough nights, people had trouble sleeping.”
The voyage was part of a massive, two-month effort by NOAA, NASA, the Department of Energy and other partners to study how the West Coast is affected by “atmospheric rivers,” an unusual weather event that can deliver half of California’s annual precipitation.
More than 30 staff members at NOAA’s facility in Boulder have played some role in the CalWater 2015 project, a $10 million effort that — if successful — would help improve weather forecasts and enable California to better prepare for harsh conditions.
The key to the campaign is understanding atmospheric rivers — one of which was tied to the storm Fairall endured for five days.
“I was surprised there were very few people who were seasick,” he said.
Common to the Pacific Ocean but found worldwide, atmospheric rivers work as their name implies. They take water vapor from one region and then — like a fire hose or squirt gun — channel it through the air to a new spot hundreds of miles away.
Unlike normal rivers, however, atmospheric rivers aren’t pinned to an exact, continuous route — though, when they do appear, it’s often in similar areas.
The most famous example is the Pineapple Express, which got its name because it carries water from Hawaii to the West Coast at a flow rate faster than the Amazon River.
(Pineapple Express also is the name of a strain of marijuana, which Fairall said led to a few jokes at the expense of the Boulder-based team.)
Thirst for atmosphere
Scientists have studied atmospheric rivers for decades, but predicting their behavior is still difficult. Depending on the conditions, they can cause destructive storms or, when weaker, deliver “rain or snow that is crucial to water supply,” according to NOAA.
Atmospheric rivers are “an integral part of Earth’s water budget,” said Allen White, a research meteorologist at NOAA. “Their role is to remove excess heat and moisture from the tropics. But when they interact with the jet stream, they get associated with storms and then are heavy rain producers.”
In the last three years, however, a persistent ridge of high pressure has diverted atmospheric rivers from California and sent the moisture north to places such as British Columbia, he said.
The result has been parched conditions in the Golden State — so much so that California officials have debated whether to force restaurant patrons to ask for water.
“Array of assets”
Because of the importance of atmospheric rivers to California’s water supply, NOAA has made it a priority to learn more about them. In addition to the ship used by Fairall, the CalWater 2015 project has deployed aircraft from NOAA, NASA and the Department of Energy. These add to ground-based observations at field sites in California.
“We have never had this array of assets tackling the atmospheric river and precipitation problem before,” said Ryan Spackman, who works for NOAA in Boulder. It’s “unprecedented.”
As part of the campaign, Spackman said he rode NOAA’s “hurricane hunter” aircraft and flew through an atmospheric river — an experience he compared to whitewater rafting. “We were skimming the bottom of the cloud,” he said.
His role has been investigating how aerosols affect atmospheric rivers. Aerosols, which range from sea salt to sulfates, are believed to affect levels of rainfall. As part of CalWater 2015, Spackman is examining whether man-made aerosols and natural aerosols have different impacts on the atmospheric rivers.
Because of its mix of the two, the California coast is a “great laboratory” for studying aerosols, he said.
As it stands, aerosol measurements are not included in forecasting models used by the National Weather Service. But Spackman said the research being done as part of CalWater 2015 could change that — and, in turn, make forecasts more accurate.
“We are a long way from that, but this is where you start,” he said.
Going with the flow
So how would this help California?
For one, improved weather forecasts would help water managers better plan for the future, White said.
The U.S. Army Corps of Engineers manages dozens of reservoirs and dams in California and — to reduce the risk of flooding — often is required to “release” thousands of gallons or more of water. With better forecasts, the Corps could be more precise with its water policy, he said.
One way to do that is better understand the mechanics of atmospheric rivers.
While aboard the Ronald H. Brown, Fairall said he observed very little interaction between the atmospheric river and the ocean below — which suggests the moisture running through the river primarily came from the tropics.
“It tells us what’s formed in the tropics is what’s in there,” Fairall said.
The observation is sure to become another data point in the ongoing effort to decode the Pineapple Express and other atmospheric rivers. Indeed, White said there has been talk of a future mission to the tropical “breeding grounds” of atmospheric rivers.
“It would be great to do that,” he said.
Mark K. Matthews: 202-662-8907, mmatthews@ denverpost.com or twitter.com/mkmatthews
spacer
![]()
Avalanche Fatalities During Atmospheric River Events in the Western United States

- February 2017
- Journal of Hydrometeorology 18(5)
spacer
![]()


RENO, Nev. (July 14, 2017) – Recently published research led by atmospheric scientists at the Desert Research Institute (DRI) demonstrates a connection between the occurrence of atmospheric river (AR) events and avalanche fatalities in the West.
Published in the May issue of the Journal of Hydrometeorology, the pilot study assessed avalanche reports, weather station data, and a catalog of AR data from a previous study to determine that AR conditions were present for 105 unique avalanches between 1998 and 2014, resulting in 123 fatalities (31 percent of all western avalanche fatalities during this time frame).
Atmospheric Rivers, as described by the National Oceanic and Atmospheric Administration (NOAA), are “relatively long, narrow regions in the atmosphere – like rivers in the sky – that transport most of the water vapor outside of the tropics.”
When ARs make landfall on the West Coast of the US they release water vapor as rain or snow, supplying 30 to 50 percent of annual precipitation in the West and contributing to cool season (November to April) extreme weather events and flooding.
Researchers conclude that the intense precipitation associated with AR events is paralleled by an increase in avalanche fatalities. Coastal regions experience the highest percentage of avalanche fatalities during AR conditions; however, the ratio of avalanche deaths during AR conditions to the total number of AR days is actually higher further inland, in states like Colorado and Utah.
“Although ARs are less frequent in inland locations, they have relatively more important roles in intermountain and continental regions where snowpacks are characteristically weaker and less capable of supporting heavy rain or snowfall,” explained Benjamin Hatchett, a postdoctoral fellow of meteorology at DRI and lead author on the study.
“This means that avalanche forecasters, ski resort employees, backcountry skiers, and emergency managers who have an increased awareness of forecasted AR conditions can potentially reduce exposure to resultant avalanche hazards, particularly if snowpack conditions already indicate weakness,” he added.
The study also reports that shallow snowpacks weakened by persistent cold and dry weather can produce deadly and widespread avalanche cycles when combined with AR conditions. Climate projections indicate that this combination is likely to become more frequent in the mid- to late- 21st century, which could create significant avalanche risk to winter backcountry enthusiasts in the West. (How would they know that?)
“With increasing numbers of recreational backcountry users and changing mountain snowpack conditions, we might expect the future to be characterized by enhanced exposure to avalanche hazard throughout the western United States,” Hatchett said. “Our results provide motivation to further increase public awareness about avalanche threats during AR events.”
Including integrated vapor transport (IVT) forecasting tools in analyses of avalanche danger, researchers suggest, could potentially allow experts to increase the accuracy of avalanche forecasts when AR conditions are present. These tools can identify structure and movement of ARs when they make landfall, and also model how ARs move inland through gaps in mountainous terrain and cause heavy precipitation further inland.
“Our study provides motivation for additional examinations of avalanche data and meteorological conditions,” Hatchett said. “Our team recommends that following all, but especially fatal, avalanches, as much detailed information should be recorded as possible so that the field can continue to learn about the relationship between atmospheric river events and avalanches.”
The full version of the study – “Avalanche Fatalities during Atmospheric River Events in the Western United States” – is available online at the link below. http://journals.ametsoc.org/doi/full/10.1175/JHM-D-16-0219.1
###
spacer
Hurricane Hunters discuss atmospheric river missions with Scripps scientists
LA JOLLA, Calif. (AFNS) — Members of the 53rd Weather Reconnaissance Squadron “Hurricane Hunters” met with scientists from the University of California San Diego’s Scripps Institution of Oceanography Nov. 29, 2017, to discuss plans for participating in atmospheric river reconnaissance missions in early 2018.
Photos

Hurricane Hunters discuss atmospheric river missions with Scripps scientists
Maj. Ashley Lundry, 53rd Weather Reconnaissance Squadron aerial reconnaissance weather officer and chief scientific officer, shows a weather data-gathering instrument called a dropsonde to Dr. Fred “Marty” Ralph, Scripps Institution of Oceanography Center of Western Weather and Water Extremes researcher and director, Nov. 29, 2017, at Brown Field Airport, San Diego. Hurricane Hunters met with Ralph and other Scripps scientists that day to discuss plans for participating in atmospheric river reconnaissance missions in early 2018. (U.S. Air Force photo by Tech. Sgt. Ryan Labadens) PHOTO BY:

Hurricane Hunters discuss atmospheric river missions with Scripps scientists
Maj. Ryan Rickert, 53rd Weather Reconnaissance Squadron aerial reconnaissance weather officer, relates how the 53rd WRS “Hurricane Hunters” gather weather data to students and researchers from the Scripps Institute of Oceanography Nov. 29, 2017, at Brown Field Airport, San Diego. Hurricane Hunters met with Scripps scientists that day to discuss plans for participating in atmospheric river reconnaissance missions in early 2018. (U.S. Air Force photo by Tech. Sgt. Ryan Labadens) PHOTO BY:
Up, up and away! 6 benefits of automated weather balloon launches

A weather balloon fitted with an ozonsonde – an ozone-measuring instrument – rises above the rock formations of Fantasy Canyon, Uintah Basin, Utah in 2013. NOAA’s National Weather Service is now piloting an initiative to automate balloon launches in Alaska (Spring 2018). (Image credit: Patrick Cullis, NOAA/CIRES)
The trusty weather balloon has been an essential data tool for forecasters for nearly 90 years.
NOAA’s National Weather Service has launched these balloons since the 1930s to collect temperature, humidity and other data in the upper atmosphere as they sail through the troposphere and stratosphere.
Fitted with special data transmitters called radiosondes, balloons are launched twice a day at 92 sites across the U.S., including 13 in Alaska. Alaska launches generate data that are especially important to support downstream forecasts for the Lower 48 states.
The NWS is piloting an initiative in Alaska to automate the process of releasing weather balloons. Autolaunch systems are being deployed across Alaska through July 2020, with some already in service.
Why switch to automation? Here are six reasons why it makes good business sense:
1. Saves money
Who doesn’t love saving a buck? How about $1 million a year? That’s how much federal tax money the NWS anticipates will be saved by using autolaunchers in Alaska in the long run. This translates to $20 million in taxpayer savings over the lifespan of the Alaska autolaunch network.
It’s also cost-neutral. The initial purchase and installation of the Alaska autolaunch stations comes at no cost to taxpayers, as they are funded exclusively by the sale of government spectrum.
2. Saves time
Autolaunchers will allow NWS’ Alaska program to move into a modern staffing model better aligned with the needs of community decision-makers and core partners across government. Staff who currently spend up to four hours per day at each site launching weather balloons will be able to refocus their work on more pressing tasks such as supporting decision-makers in the field, providing weather support for emerging needs in the Arctic or for forecasting and communicating about ocean and ice, aviation weather, volcanic ash and tsunamis.
3. Improves data quality and availability
Autolaunchers are kind of like the postal carrier: No matter what the weather, they deliver. Manual launches in Alaska can sometimes be disrupted due to staff shortages. Autolaunchers ensure that balloons are launched as planned – twice a day at every site, every day of the year.
Automation also makes it easier to launch extra balloons to collect more data ahead of major weather events.
4. Works in a wide range of climates and environments
Autolaunch technology has been proven effective worldwide over the last 20 years, from the sweltering Australian outback to sub-Arctic Finnish Lapland. Initial tests in Kodiak, Alaska, show that autolaunchers are as effective as launches by hand and have a 98-percent success rate, which beats the agency’s target by two percent.

5. Provides longer career tracks and less isolation for NWS employees
The NWS’s 11 remote Weather Service Offices in Alaska are staffed by three people solely to launch weather balloons. The geographic isolation is tough on families and results in high staff turnover and ongoing vacancies. Autolaunchers offer these employees an opportunity to gain new areas of expertise and move into jobs with better career growth potential. (So, they are not really relieving qualified staff to use their time more efficiently. They are replacing unqualified staff who are left to find a job.)
6. Operates on autopilot
Autolaunchers send up 24 balloons before they need to be restocked, taking vital upper-air observations for 12 days on autopilot. Restocking the autolauncher with balloons, gas and radiosondes only requires about an hour to accomplish.
spacer


GOES satellite image of the atmospheric river phenomena from March 20, 2018. Graphic: NOAA

Photo by Serkan Senturk | iStock
March 13, 2019
In December 2016, meteorologist F. Martin Ralph was sitting in a restaurant in San Francisco. On the TV screen, the weather report was talking about a particular kind of weather formation called an atmospheric river, which was headed right for California.
Atmospheric rivers are exactly what they sound like—rivers of water vapor, flowing through the atmosphere. They move from the tropics toward the continents and poles, stretching to as much as 375 miles wide and carrying more water than multiple Mississippi Rivers.
When an atmospheric river meets mountainous terrain like the Sierra Nevada, the water vapor condenses and becomes rain or snow. Strong atmospheric rivers can bring about floods and landslides, but the water and snowpack they leave behind provide California with 25 to 50 percent of its yearly precipitation in just a few days.
Back at the restaurant, Ralph looked up at the symbols for the weather forecast on the television. There was a little sun on Monday, then a cloud on Tuesday, and a dark heavy cloud on the day that the atmospheric river would arrive. A little, dark cloud seemed nowhere near close to conveying the danger that some Californians would be in when the storm arrived. “I found those symbols and the explanation to be wholly inadequate in terms of conveying to the public that there’s potentially a major storm on the horizon.” That was the moment he decided to develop a new way of showing just how much or how little risk an atmospheric river poses to the communities in its path.
A Double-Edged Sword?
Ralph is director of the Center for Western Weather and Water Extremes (CW3E). On the West Coast, he says, scientists have studied atmospheric rivers for well over a decade. Research on atmospheric rivers has shown that they are responsible for most of the extreme precipitation and flooding events that take place in California and other parts of the coast. Historically, the larger and stronger atmospheric rivers have been responsible for major floods (like the recent ones on the Russian River and in Riverside, California) as well as storm surges, extreme winds, breached levees, and landslides—especially in areas that have recently burned in wildfires. Close to 70 percent of postfire debris flow in Southern California can be traced back to atmospheric rivers.
But atmospheric rivers also provide much of the coast’s snowpack and water supply. The presence or absence of them can “make or break” California’s water supply for the year and be the difference between full reservoirs or drought. “They are a two-edged sword, because on the one hand, you really need the moisture that’s associated with atmospheric rivers for the water supply, but on the other hand, if you get too much, in a really big atmospheric river, then you get a lot of flooding and negative consequences,” says Rob Cifelli, a radar meteorologist at NOAA.
Predicting the path and frequency of atmospheric rivers isn’t easy. All sorts of factors affect whether there will be an active season, including the condition of the Pacific Ocean, the tropics, the Arctic, and El Niño.

 MIMIC-TW data of global precipitation collected by the Space Science & Engineering Center at the University of Wisconsin-Madison
Can Technology Help?
One of the problems with measuring how intense an atmospheric river is going to be is that they largely form over the Pacific Ocean, far away from weather-monitoring installations. CW3E is testing out ways to measure this intensity by dropping devices that measure temperature, pressure, wind, and water vapor from research aircraft flying above the storms. NOAA, with support from other federal and state agencies, has built seven Atmospheric River Observatories (AROs) along the West Coast, from Southern California to the Canadian border, that also collect and relay data about a storm as soon as it makes landfall.
Typically, an atmospheric river moves down the coastline from north to south, so the National Weather Service and other organizations can look at ARO data and predict what an atmospheric river’s impacts will be farther south. Near Seattle, says Cifelli, the Army Corps of Engineers uses ARO data to estimate when it needs to release water from the the aging Howard A. Hanson Dam in order to prevent it from overfilling and possibly bursting during an atmospheric river storm.
In California, the Department of Water Resources uses this information in a similar way. “They use the information to help them get a better sense of how much and how hard it’s going to rain and, more importantly, to get an accurate estimate of the freezing level,” Cifelli says. As you go up in altitude, the air gets colder and colder, and at some point it freezes. If it happens to be precipitating at this point, that means the rain turns over to snow.
“This freezing level is really important in the West, because if you have a watershed and most of your precipitation is falling as snow, then the risk of flooding is reduced because the snow is going to melt off slowly,” Cifelli adds. “It’s not a problem compared to a case where most of the precipitation falls as rain and it could run off and cause flooding.”
As the data collected on atmospheric rivers continues to add up, it will improve forecasts of the storms to come. When weather prediction models get direct observations like the ones these AROs provide, says Cifelli, scientists can then compare them to what the forecast model says it was going to be. And if the model agrees pretty well with the observation, then you have more confidence that it is going to make a good forecast, but if it doesn’t, you might put a little less credence in the model forecast and look into ways of improving it.
Before the AROs were installed, NOAA relied purely on climate models to predict the forecast. “A model is as good as the information that’s going into it,” adds Cifelli. “Without those observatories the models were less anchored in reality, and so you had less information to help decide what you needed to do in terms of managing your water resources.”
The Future
Atmospheric rivers could become more intense and unpredictable as climate change continues to change weather patterns, according to the Fourth National Climate Assessment, a federal report released in November. In the future, according to a 2018 NASA-led study, the frequency of the most intense atmospheric river storms is projected to nearly double.
As the atmosphere warms, it is able to hold more water vapor, and because water vapor is essentially the fuel for atmospheric rivers, it’s possible that atmospheric rivers will become stronger and more common—though it’s also possible that some other consequences of climate change could cancel those effects out.“The strength of an atmospheric river depends not just on how much water vapor is in the air but how strong the winds are,” says Ralph. “Some climate change factors reduce that.”
The difference in temperature between the North Pole and the equator can drive the creation of storms, including atmospheric rivers. As climate change narrows the temperature difference between the pole and the equator, the result could be less potential energy that could become the kinetic energy of a storm.
Still, says Ralph, there will be some storms in which the wind is as strong as it is today but the atmosphere is warmer and has more water vapor in it. In those cases, the atmospheric river is going to be stronger.
For areas along the West Coast that are already impacted by strong atmospheric rivers, this would mean more and more hazardous conditions for its inhabitants. That’s one reason why the atmospheric river measurement scale that Ralph started developing in 2016 and published this February in the Bulletin of the American Meteorological Society, is so important.
The scale ranks atmospheric rivers from one to five and creates the categories “weak,” “moderate,” “strong,” “extreme,” and “exceptional” for them, based on their intensity. Last month, an AR Cat 4 swept along the San Diego coast over Valentine’s Day, reaching “extreme” intensity. Almost 20 percent of San Diego’s average annual rainfall fell in one day, and several rivers flooded.
We don’t entirely know yet how climate change will affect atmospheric rivers. But in the meantime, they need to be classified, says Ralph, just like hurricanes or cyclones are. That way, the people in their path can clearly see the risks ahead.
California Funds Atmospheric Rivers Research
A better understanding and forecasting of atmospheric rivers could improve flood control and water management in California.
The 2019-20 California state budget includes $9.25 million to pay for research into how the state Department of Water Resources can more accurately track the intensity and landfall locations of atmospheric rivers. About half of the state’s annual rainfall and 90 percent of its flooding come from such events.
“Improved forecasting and monitoring of atmospheric river storms would benefit not only California, but the Southwest, in managing our water supply,” said Kelley Gage, director of water resources for the San Diego County Water Authority. “With better forecasting, water managers could also prepare and plan for flooding events caused by the atmospheric rivers.”

The science behind atmospheric rivers. Graphic: NOAA
Rivers in the sky
Atmospheric rivers are relatively long, narrow regions in the atmosphere – like rivers in the sky – that transport most of the water vapor outside of the tropics, according to NOAA. When the atmospheric rivers make landfall, they release the water vapor in the form or rain or snow.
“The rivers can stretch from 250 to 370 miles wide and carry a water amount more than 7 times the volume of the Mississippi River,” said Alexi Schnell, water resources specialist with the Water Authority.
The research funds were allocated to the Department of Water Resources to “improve observations, forecasts and decisions in support of atmospheric river precipitation events” as part of the DWR’s Research, Mitigation, and Climate Forecasting Program.

Atmospheric Rivers in Water Year 2019. Graphic: Center for Western Weather and Water Extremes
Volatile water resources
A new study led by Scripps Institution of Oceanography at UC San Diego suggests that a new regime of wet and dry extremes is emerging in California. The study shows that the projected increase of extreme precipitation is likely to be caused by streams of moisture in the sky known as atmospheric rivers.
The study was published July 9 in the journal Nature Scientific Reports.
“California already has the most volatile water resources in the country,” according to a news release from Scripps. “Scripps scientists discovered that the state’s precipitation, as it becomes less frequent but preferentially stronger, will vacillate even more wildly between extremes of drought and flooding as a consequence of climate change.”
The federal Bureau of Reclamation, the Southwest Climate Adaptation Science Center, NOAA, the U.S. Geological Survey, and NASA funded the study, “Precipitation regime change in Western North America: The role of Atmospheric Rivers.”
California weather extremes
“As Mediterranean climate regions around the world are becoming more subtropical, the dry season is expanding. California is no exception,” said Alexander Gershunov, a climate scientist at Scripps. “What is exceptional about California is that the heavy precipitation is projected to become more extreme. We knew this from our past work. Now we have identified the mechanism responsible for this bolstering of extremes, and that gives us a more nuanced understanding of what to expect from future hydroclimate and a clearer interpretation of ongoing changes.”

Atmospheric Rivers boost snowpack
During the 2018-19 winter, atmospheric river events significantly increased snowpack in the Sierra Nevada and the Rocky Mountains. Both areas are key sources of water supply for the Southwest, including California and San Diego County.
Precipitation in the contiguous U.S. was above average from January to June 2019, according to a NOAA climate report released this week. The report said the 19.05 inches during the six-month period was 3.74 inches above average and the wettest such period in the 125-year record.
The January-to-June 2019 precipitation map showed California’s statewide precipitation was “above average” and “much above average.”
TO STUDY ATMOSPHERIC RIVERS, SCIENTISTS NEED TO GET CLOSE. SO THEY FLY TO THEM
The Air Force research crew on the WC-130J Super Hercules airplane was cruising at 28,000 feet over the Pacific Ocean, preparing to deploy 25 weather-sensing devices over a long band of water vapor known as an “atmospheric river” when the hazards of air travel got in the way of science.
![]()
Flooding the Sky: Navigating the Science of Atmospheric Rivers10 min read

This storm over the Russian River in California was driven by an atmospheric river. Every time this river flooded between 2004 and 2014, it was because of one of these “rivers in the sky.” Image courtesy of National Oceanic and Atmospheric Administration
Ice crashed down on the windshield of the small plane. Rain pounded the wings. Water sloshed inside important instruments.
For most pilots, this would be a nightmare.
But still, the plane climbed up through the clouds. It ascended more than 5,000 feet above the ocean.
For this team, these conditions were ideal. In fact, they had been waiting for this moment.
This aircraft, along with three other planes and a research boat, were collecting data on atmospheric rivers—large, narrow sections of the atmosphere that run from the tropics to higher latitudes. Each carries about the same amount of water vapor as liquid water flowing through the mouth of the Amazon River. Upon reaching land—especially coastal areas next to mountains—they jettison much of this moisture. That causes massive amounts of rain and snow to fall.
The vehicles and equipment inside of them were operated by U.S. government agencies to better understand how atmospheric rivers act. The small plane spiraling up through the clouds was run by the Atmospheric Radiation Measurement (ARM) facility, a user facility managed by the Department of Energy’s (DOE) Office of Science. The other aircraft were supported by the U.S. National Oceanic and Atmospheric Administration (NOAA) and the U.S. National Aeronautics and Space Administration (NASA). There was also a research vessel from NOAA and instruments from the National Science Foundation (NSF) and DOE.
Probing observations, satellite data, and climate models, scientists supported by the DOE’s Office of Science are exploring atmospheric rivers’ role in the water and climate cycles. But navigating through the data proved to be trickier than the scientists expected.
Massive Rivers in the Sky
Rivers with liquid water carve a path through the landscape. Similarly, atmospheric rivers have big impacts on their surroundings. Starting over oceans, they’re steered by the westerly winds in the subtropics and extratropics. When they reach land, they smash into the west coasts of continents. The West Coast of the United States, Western Europe, and Western South America all feel their impacts: good and bad.
Upon landfall, atmospheric rivers often bring extreme winter storms. Every time the Russian River in California flooded from 2004 to 2014, an atmospheric river was to blame. These storms can also bring strong winds and follow-on effects like landslides.
But they can also be a savior. Atmospheric rivers’ precipitation provides about 50 percent of the U.S. West Coast’s water supply. Sometimes called “drought-busters,” they ended up to three-quarters of the droughts in the Pacific Northwest from 1950 to 2010.
“Atmospheric rivers are important not only for the short-term, high-impact weather events that are often garnering media attention,” said Jonathan Rutz, an atmospheric scientist at NOAA’s National Weather Service who partners with scientists supported by DOE. “They’re also critically important in the longer term because they provide a lot of the snowpack that turns into the summertime water resources that we need to get us through the year in the West.”
Predicting if an atmospheric river will bring help or disaster—or both—is a major focus of scientists’ efforts. Knowing where and when an atmospheric river will lead to precipitation—as well as how much it will produce—can help water managers and weather forecasters better predict the future.
Pinning down these rivers’ behavior is also essential to improving computer programs that model the climate. At the poles, they’re a major influence on whether huge amounts of snow accumulate or melt.

Yang Zhou
“Atmospheric rivers are responsible for 90 percent of the polarward moisture transport around the globe,” said Yang Zhou, a postdoctoral researcher at DOE’s Lawrence Berkeley National Laboratory. “Which gives them a very important role in the global hydrological cycle.”
Atmospheric rivers vary a lot from year to year and season to season. As a result, they’re hard to model. Climate change may make them even more unpredictable.
“We may not be able to depend on [the rivers] as much as we have in the past,” said Ashley Payne, an assistant professor of climate and space sciences and engineering at the University of Michigan. Referring to the future, she said, “In addition to changes in atmospheric river intensity, we need to understand how their variability will change.”
A Storm of Data Analysis
There were only a handful of papers in the years after researchers first described atmospheric rivers in the 1990s. But the field exploded in the last decade. In 2015 alone, there were more than 200 scientific papers that mentioned them.
“There were a few studies in the mid-2000s that really caught a lot of attention,” said Ruby Leung, a Battelle fellow at DOE’s Pacific Northwest National Laboratory and the chief scientist on the Energy Exascale Earth System Model (E3SM) project. Those studies underlined both atmospheric rivers’ international nature and big impacts. “It caught the attention of water managers. A much broader community became interested in this.”
Much of the research explores existing satellite data. A recent study by Zhou and her colleague looked at how atmospheric rivers’ initial location over the Pacific Ocean influences their characteristics. The team tracked the life cycle, intensity, and path of every atmospheric river from 1979 to 2019. They found 24 atmospheric rivers hit the West Coast on average each winter. Tracking the rivers’ patterns can help water managers predict where they will appear before they even form.
Other research examines how best to represent and predict atmospheric rivers in computer models. A 2015 study by Leung’s team showed that as scientists increased the spatial detail in the most current Earth system model at the time, the model predicted fewer atmospheric rivers. But that’s not what was happening in real life. The model was overly sensitive because it was having trouble describing where moisture and subtropical winds were moving. This analysis helped scientists improve the model’s accuracy.
Researchers also use models to explore the relationships between atmospheric rivers and their effects. “We’re interested in what kind of large-scale atmospheric conditions are present when atmospheric rivers occur because it’s easier to look at how those conditions change in simulations,” said Naomi Goldenson, a researcher at the University of California, Los Angeles (UCLA). She used climate models to determine the relationship between atmospheric rivers and mountain snowpack in the Northwest U.S. A large number of winter-season atmospheric rivers resulted in more snowpack in the high and cold Sierra Nevada and Rocky Mountains. In contrast, those large numbers of rivers resulted in less snowpack in the wetter, lower Cascade Mountains.
Field observation campaigns allow scientists to discover new insights that aren’t available from existing data. The CalWater 2015 field campaign that ARM participated in was particularly thorough. It provided scientists with a rather unusual view of atmospheric rivers.
“It was quite fun. I am mostly a modeler who usually works in front of a computer,” said Leung, who rode in one of the flights. “That was an experience for me trying to see what I’m actually trying to model with computer code.”
A Flood of Definitions
Even in research, there can be too much of a good thing.
As more researchers dove into studying atmospheric rivers, they discovered there was no quantitative definition. So researchers developed their own. But there are a lot of variables you can choose from. Even the main variable—how much water vapor an atmospheric river is moving per meter per second—can be defined in many ways. The measurement depends on which area within the long, narrow band of moisture one even calls an atmospheric river.
The community ended up with a jumble of definitions. Those resulted in conflicting results. Three separate studies said that atmospheric rivers caused between 15 to 35 percent of California’s precipitation—a huge range. Navigating through the data became challenging.
“I would be talking about an orange and I’d be talking to someone who was talking about an apple, but we were talking about atmospheric rivers,” said Payne. “We had no baseline to compare our results.”
But the differences offered an opportunity to work together.
“It combines the weather and climate communities,” said Goldenson. “We don’t always speak the exact same language or the same priorities or the way we approach the problem. That’s both a challenge and a benefit.”
Chasing Down a Set of Solutions
Tackling the problem, the community launched the Atmospheric River Tracking Method Intercomparison Project (ARTMIP). The project is creating a framework that will help scientists compare methods of identifying and tracking atmospheric rivers. That framework will enable scientists and stakeholders to choose the right method for their application. Scientists have embraced the collaboration.
“It’s a really friendly environment and everyone’s willing to discuss,” said Zhou. “The ARTMIP project is not a competition for the best method.”
So far, the project has tested 20 different approaches on a baseline data set. For each three-hour time period in the data, the project pinpoints if a method says whether or not there is an atmospheric river present along the California coast. Which measurements the techniques used led to big differences in the number of atmospheric rivers they identified.
“As far as I’m aware, there’s nothing else like this that’s ever been done before,” said Rutz.
But they also found that the methods weren’t as different as they first seemed. Most of them measured the same features. Instead, their dissimilarities came from how strict or broad their definition was. Strict definitions mainly identified strong atmospheric rivers. Broad definitions counted weaker ones as well. Each type of model had its own advantages and disadvantages, depending on the situation.
Researchers are already putting these conclusions into practice. A study by Leung and her team examined atmospheric rivers’ characteristics that cause extreme precipitation on the U.S. West Coast. Comparing six different methods identified by ARTMIP, they saw three different types of atmospheric rivers: short-duration and low-intensity ones, short-duration and high-intensity ones, and long-duration ones. The more restrictive methods only identified the high-intensity rivers. As a result, they were better at predicting extreme precipitation. Based on the analysis, the scientists found a way to identify seven to 10 days in advance which atmospheric rivers could cause extreme precipitation on the West Coast.
Now, the ARTMIP group is developing a scale from one to five that categorizes atmospheric rivers. It’s based on the amount of water vapor the rivers transport and their life cycle.
While the new definitions will be helpful, it’s the researchers’ collaboration—whether in the sky or conference rooms—that will allow them to effectively make their way through these rivers.
“It’s bringing together people who are approaching this problem from different angles,” said Goldenson. “I find that to be the most valuable in terms of potential for advancing our understanding even more than just comparing the raw numbers.”
The Office of Science is the single largest supporter of basic research in the physical sciences in the United States and is working to address some of the most pressing challenges of our time. For more information, please visit https://energy.gov/science.
spacer

Expert comment: UK floods from Storm Christoph caused by ‘atmospheric river’
21 January 2021

 Helen Griffith, a research scientist studying atmospheric rivers at the University of Reading, said:
“Our early analysis suggests that we can blame a particularly large atmospheric river for the heavy, persistent rain that came with Storm Christoph. In a sense, it is not surprising that many rivers on the ground are now reaching record levels, as some atmospheric rivers have been found to carry as much water as the Amazon or the Nile.
“Atmospheric rivers are narrow regions of air that transport water through the lower atmosphere in long, narrow bands. Scientists have been aware of them for a while in the US, but we are only just beginning to be able to observe and predict them properly in Europe. In the UK, these intensely wet regions of air are often associated with winter storms from the Atlantic, such as Storm Desmond in December 2015, and Ciara and Dennis in February 2020. When atmospheric rivers hit land, the low-lying wet air is pushed up over the coast, leading to heavy rain that goes on and on.
“We are currently conducting research at the University of Reading and European Centre for Medium-range Weather Forecasts (ECMWF) to understand more about atmospheric rivers to improve operational flood forecasts. While we knew Storm Christoph was coming, we didn’t know exactly where it would strike and dump its water, so we need to understand more about how and where atmospheric rivers interact with the land surface. We published a scientific paper outlining this work in 2020.
“At the moment, the UK usually gets three or four atmospheric rivers each winter, although not all lead to the impacts on the scale of Storm Christoph. However, atmospheric rivers are predicted to get bigger, and more frequent, as a result of a warming climate. Linking climate change to flooding is often difficult, but atmospheric rivers are one of those phenomena where the fingerprints of human activity may be all too evident. We will need to prepare for more floods like these in the future.”
spacer
In a first, scientists map particle-laden rivers in the sky
APRIL 30, 2021

Windy regions high in the atmosphere can transport pollutants like dust or soot thousands of miles around the world and disrupt everyday life for thousands of people.
Last summer, “Godzilla” came for the Caribbean and the U.S. Gulf Coast. This particular monster wasn’t of the sci-fi variety, but, rather, a massive dust storm kicked up by winds from the Sahara Desert and carried an ocean away. The dust storm was an extreme example of a phenomenon that happens regularly: the global transport of dust, soot, and other airborne particles, collectively known as aerosols, by jets of winds in the atmosphere. The result is the formation of what are called aerosol atmospheric rivers.
Gaining a better understanding of how these particles are transported around the globe is important because certain aerosols can nourish rainforest soil, help or hinder cloud formation, reduce visibility, or affect air quality—which can impact human health. But studies of aerosol transport have tended to focus on single events in a particular part of the world. There wasn’t really a way of looking at them in a holistic, global way.
|
, Anthony C. Delany, Audrey C. Delany, and Toby N. Carlson
|
In a first, a recent study published in the journal Geophysical Research Letters does just that. Five types of aerosols are of particular interest to researchers: dust, two kinds of carbon particles (soot and organic carbon), sulfate (emitted during events like volcanic eruptions or the burning of fossil fuels), and sea salt. The authors identified where aerosol atmospheric rivers tend to occur and how often extreme events, similar to the Godzilla dust storm, happen each year. To do this, they took a computer program they previously developed to detect atmospheric rivers around the world that move water vapor and produce precipitation, and they modified it to detect aerosol atmospheric rivers instead.
The shift from using atmospheric rivers to study the movement of water vapor to using them to study aerosol transport was something of a revelation, because researchers only started to use the global detection framework of atmospheric rivers to look at the movement of extreme amounts of water vapor about six years ago. The concept of atmospheric rivers is only about 20 years old.
“It took scientists time to recognize and leverage atmospheric rivers as a concept,” said Duane Waliser, one of the study’s co-authors and an atmospheric scientist at NASA’s Jet Propulsion Laboratory in Southern California. And it wasn’t until Waliser was speaking to his colleague, Arlindo da Silva, an aerosol researcher at NASA’s Goddard Space Flight Center in Greenbelt, Maryland, about the atmospheric river concept that a light went on for both of the researchers. “‘We should take our algorithm and apply it to your aerosol dataset,'” Waliser said.
Location, Location, Location
After modifying the atmospheric river algorithm for aerosol atmospheric rivers, the study’s authors applied it to a state-of-the-art reconstruction of Earth’s atmosphere called the Modern-Era Retrospective analysis for Research and Applications, Version 2 (MERRA-2) from NASA’s Global Modeling and Assimilation Office. It incorporates datasets from satellites, airborne instruments, and sensors on the ground from 1980 to the present to produce a representation of the structure of Earth’s atmosphere every six hours.
spacer
MERRA-2 enabled the researchers to look back in time to analyze the location and frequency of aerosol atmospheric rivers around the world from 1997 to 2014. The study authors found that regions including the Sahara, Patagonia, Asian deserts, and Namibia are big sources of dust aerosol atmospheric rivers, while areas like the eastern U.S., the southern Amazon and Africa, and northern India tend to produce ones dominated by soot resulting from wildfires and the burning of fossil fuels.
The analysis also showed these atmospheric rivers tend to move large amounts of aerosols in a limited number of extreme events instead of in a steady stream throughout the year.
“We were astonished to find that a few major events a year can transport between 40% to 100% of the aerosols moved by the atmosphere,” said Sudip Chakraborty, an atmospheric scientist at JPL and a study co-author.
Now that scientists have a way of looking at aerosol atmospheric rivers globally, the framework gives them a way to study how these particle-laden rivers in the sky affect Earth’s climate. This includes how aerosols interact with clouds to potentially supercharge storms, how they trap or reflect heat in the atmosphere, and whether phenomena like El Niño and La Niña affect atmospheric aerosol river pathways and frequency.
The new approach also gives researchers insight into how aerosol atmospheric rivers could affect communities around the world, through their impacts on air quality and visibility and their ability to move plant pathogens that can affect crops. “When you realize a lot of the transport is happening in just a few big events, then you know to focus on those big events,” said da Silva.
spacer
What Is an Atmospheric River? Explaining the Blessing and Curse

Jon Erdman
An atmospheric river is a weather feature that is both a necessity and, all too often, a destructive menace particularly for those near the West Coast of the United States.
Put simply, an atmospheric river (AR) is a thin but long plume of moisture in the atmosphere that stretches from the tropics or subtropics into higher latitudes.

The term was first used in a 1994 research paper and is now widely used by meteorologists.
A more recent study published in August 2015 by the University of Reading and University of Iowa questions whether the term “atmospheric river” is misleading.
The study argues that the AR may not be so much a moisture pipeline from the tropics or subtropics, as previous conceptual models, but rather simply a “footprint” of moisture ahead of the cold front.
One type of AR you’ve probably heard of is the “Pineapple Express,” a moisture band lined up from near Hawaii to the U.S. West Coast ahead of a strong Pacific cold front at least once or twice each fall, winter or spring.
They’re Destructive …
Regardless of how they’re formed or maintained, these atmospheric rivers contain an incredible amount of moisture.
According to NOAA’s Earth System Research Laboratory (ESRL), a strong AR can transport as water vapor up to 15 times the average flow of liquid water at the mouth of the Mississippi River.
A separate University of Reading study in 2013 found one AR in 2009 over the United Kingdom contained 4,500 times more water than the average flow in the River Thames in London.
Still not impressed? A 1998 MIT study estimated the moisture flux of an AR is roughly the same as that of the Amazon River, about 176,000 tons per second.

If an atmospheric river stalls over land, particularly when that moisture is lifted by mountainous terrain, significant flooding often is the result.
A 2006 study led by F. Martin Ralph of Scripps Institution of Oceanography found atmospheric rivers were responsible for all seven floods of northern California’s Russian River in the seven-year period of study.
About 80% of California’s major flood events can be traced to ARs, even though only ARs accompany only 17% of West Coast storms, according to NASA.
But isn’t all this moisture wrung out over California’s Sierra a good thing, given the state’s dependence on melting snowpack for water supply?
Only if it falls as snow.
A 2016 study by NASA, NOAA, UCLA, and Scripps Institution of Oceanography found that atmospheric river events are 2.5 times more likely to produce “rain over snow” events, or rain falling on existing Sierra snowpack.
These warm AR events diminish the snowpack available to slowly melt and recharge reservoirs for the summer dry season, instead, triggering more serious flooding. Oddly, it’s a net loss for California’s water supply.
NOAA/ESRL has a list of AR events, primarily along the U.S. West Coast, that have appeared in peer-reviewed studies since the mid-1980s.
… But They’re Essential
You might say parts of the U.S. West Coast have a love-hate relationship with atmospheric rivers.
Up to half of the average annual precipitation near the West Coast of the U.S. comes from just a handful of weather events featuring an AR.
If the AR events aren’t too warm to produce rain over snowpack, they’re extremely beneficial for water supplies.
Atmospheric rivers can dump some of the heaviest multi-day snowfalls you’ll find anywhere in North America over the Sierra and Cascades, sometimes amounting to over 100 inches of snow in a week or less.
This can turn worry into relief among local water authorities when a so-called “miracle March” AR event boosts Sierra snowpack after a disappointing winter.
Atmospheric rivers are, in fact, vital to the Earth’s water cycle.
The 1998 MIT study mentioned above found that ARs are responsible for at least 90% of all atmospheric water vapor transport in the middle latitudes.
A study published in February 2019 unveiled a new scale for ranking the severity and impacts of atmospheric rivers.
Not Just a U.S. West Coast Phenomenon
Atmospheric rivers are a flood concern in other parts of the world, as well.
In fact, there are three to seven such ARs present worldwide all the time.

These can be best seen on a global composite precipitable water (atmospheric moisture) loop from UW-CIMSS and Scripps Institution of Oceanography as thin fingers of moisture stretching poleward from the subtropics.
For instance, one impressive AR over 5,000 miles long accompanied Storm Desmond in December 2015, triggering massive flooding in parts of the U.K., Ireland, even Norway.
There’s concern this type of winter AR event may become more common in the U.K., according to a 2013 University of Reading study.
The Nashville May 2010 flood was found to have had a contribution from an atmospheric river from the eastern tropical Pacific basin.
An AR even chipped its moisture into the infamous “Snowmageddon” mid-Atlantic snowstorm from Feb. 5-6, 2010, according to NOAA/ESRL.
The East Asian procession of heavy rain events from late spring into summer, known in China as the Mei-Yu season, often gets a boost from atmospheric rivers.
They’re Predictable
Fortunately, thanks to advances in scientific research, numerical modeling and satellite technology, meteorologists can detect and forecast atmospheric river events sometimes up to a week in advance.
Given their impact, ARs remain an active area of research.
One such field program in winter 2015-16, headed by the Scripps Institution of Oceanography, is utilizing hurricane hunter aircraft.
Dropping sensors into atmospheric rivers over the Pacific Ocean, the WC-130J aircraft collect data on moisture and winds, with the goal of improving forecasts, which are typically based heavily on satellite data only.
The Weather Company’s primary journalistic mission is to report on breaking weather news, the environment and the importance of science to our lives. This story does not necessarily represent the position of our parent company, IBM.
By flying over atmospheric rivers, scientists aim to improve forecasts
These drenching storms are pummeling the U.S. West Coast, bringing dangerous flooding and snow

JUSTIN SULLIVAN/GETTY IMAGES
The term “atmospheric river” may sound airy and ethereal, but these massive, fast-moving, drenching storms can hit as hard as a freight train. Since December, the U.S. West has been slammed with back-to-back-to-back atmospheric rivers, the most recent one deluging the state March 15 and another forecast to hit the state in the coming week. These powerful streams of water vapor arrive with strong winds, heavy rains and thick snow, spawning flooding, landslides and avalanches.
Big as they are, these storms are surprisingly tough to see coming. A week’s warning is about the best forecasters can do now.
A team of scientists is trying to change that. In just the past few months, they’ve flown more than three dozen reconnaissance missions into the storms. They’ve launched dozens of weather balloons high into the stratosphere, each carrying instruments to measure temperature, moisture, air pressure and wind. And the scientists have crunched reams of data and run hundreds of computer simulations, all to forecast when the next atmospheric river is going to arrive and how intense it’s likely to be.
The goal of this effort, the team says, is to improve predictions, to give the people in the storms’ path more time to prepare for flooding, and ultimately to find ways to manage the water for the region’s drier months.
It’s a big task, particularly during this year’s seemingly relentless barrage of storms. “We have been hammered here: December, January, February, March,” says meteorologist Marty Ralph. “It has been a long and active season.”
In just December and January, nine atmospheric rivers hammered western United States and Canada relentlessly, dumping record rain and snow across the region. Over 121 billion metric tons of water fell on California alone, according to the U.S. National Environmental Satellite Data and Information Service.
And this task is likely to become even more challenging, given lingering uncertainty over how atmospheric rivers will shift in intensity and frequency as the planet continues to warm.
To improve their forecasts of landfall and intensity, the team collects data from drifting ocean buoys, weather balloons and airplanes. The group even enlisted the aid of the U.S. Air Force’s hurricane hunters — most famous for flying into the eyes of tropical cyclones from June to November — to do aerial reconnaissance (SN: 5/18/12).
The data collected by the planes fill an important information gap, says Anna Wilson. She’s a Scripps atmospheric scientist who also manages field research for CW3E. Weather balloons are the workhorses of weather prediction, but they’re launched over land, and “it’s important to see what happens before [an atmospheric river] makes landfall,” Wilson says.
Satellites can provide valuable atmospheric data over the ocean, but they generally can’t see through clouds and heavy precipitation, both characteristic features of atmospheric rivers. And atmospheric rivers hang low in the troposphere, the lowest part of Earth’s atmosphere, making it even harder for satellites to spy on them.
During each flight mission, the planes drop instruments called dropsondes that collect temperature, moisture, wind and other data as they fall. Since November 1, the hunters have flown 39 missions into the atmospheric rivers, Wilson says.
How to study atmospheric rivers
Before atmospheric rivers make landfall, temperature, moisture, pressure and wind data are collected by satellites, drifting buoys in the ocean and by airplanes that fly over the top of the atmospheric river (orange and yellow), releasing dropsondes, instruments that gather data as they sink through the air. The planes are also using an innovative technique called airborne radio occultation that uses GPS satellites and the slant of the horizon to measure atmospheric moisture to the sides of the flight paths.

In the U.S. West, atmospheric rivers tend to arrive from January through March. But that’s not really the start of atmospheric river season in this region: Atmospheric rivers make landfall in the Pacific Northwest earlier in the year, in the late fall. One such storm devastated that region in November 2021, spawning a deadly series of floods and landslides.
“That storm not only hurt people, it hurt the economy,” Ralph says, causing “thousand-year flooding that destroyed rail lines right in the middle of a serious supply chain issue.”
In the aftermath of that event, CW3E and their partners received funding to begin the airplane reconnaissance flights on November 1, two months earlier than these missions have begun in the past.
How will climate change affect atmospheric rivers?
Aside from the data-gathering challenges in predicting these storms, it’s also hard to disentangle the many factors that feed into them, from warm tropical waters to large-scale weather patterns such as the El Niño Southern Oscillation. How a warming world will influence on these storms is uncertain too, Ralph says.
“One thing to keep in mind is that the fuel of an atmospheric river is water vapor. It’s pushed along by the wind, formed by the temperature gradient between the poles and the equator,” he says.
Atmospheric rivers are also often associated with extratropical cyclones, mid-latitude storms formed by the collision of cold and warm water masses. Such cyclones can interact with an atmospheric river, perhaps pulling it along. One such fast-forming “bomb cyclone” helped spur on an atmospheric river that drenched California in January.
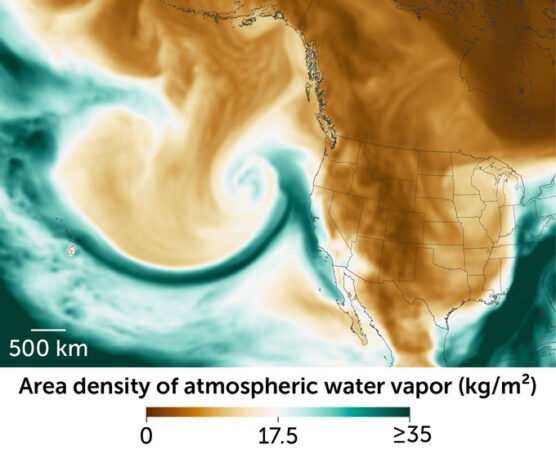
Global warming may be having two possibly offsetting effects on atmospheric rivers: Warmer air can hold more water vapor, which means more fuel for the storms. But the poles are also warming faster than the equatorial regions, which reduces the temperature difference between the regions, and that can weaken the winds.
“But what we’re finding is that even with that reduced gradient, there are still times when cyclones can form,” Ralph says. And those storms are feeding off the increase in water vapor. That, he says, could mean bigger and longer-lasting atmospheric rivers in the future.
Some studies suggest climate change won’t necessarily increase the number of atmospheric rivers, but it might increase their variability, Wilson says. “We may have more frequent shifts between very, very, very wet seasons and very, very, very dry seasons.” A warmer climate in general can mean that water is sucked up out of the soil more quickly.
That seesaw scenario is likely to make water management even more of a challenge in the U.S. West, where atmospheric rivers are already both a blessing and a curse. Still, “we’re very hopeful,” Wilson says, that the data will ultimately aid in the region’s complicated water management, such as by giving planners enough time to safely let water out of reservoirs before they’re flooded.
The events also provide as much as half of the region’s annual precipitation, bringing much-needed water to parched lands and topping off the snowpack in the high mountains, another reservoir of freshwater. This year’s storms “have done a lot to restore the landscape drought,” Ralph says, “greening up” the landscape and refilling many smaller reservoirs.
But “drought is a complicated thing,” Ralph says (SN: 4/16/20). The historically low water levels in larger reservoirs in the West, such as Lake Powell and Lake Mead, isn’t so quickly replaced. “It will take more wet years like this one to recover.”
spacer
The role of atmospheric rivers in the distribution of heavy precipitation events over North America
Atmospheric rivers (ARs) are filaments of extensive water vapor transport in the lower troposphere that play a crucial role in the distribution of freshwater but can also cause natural and economic damage by facilitating heavy precipitation. Here, we investigate the large-scale spatiotemporal synchronization patterns of heavy precipitation events (HPEs) over the western coast and the continental regions of North America (NA), during the period from 1979 to 2018. spacer
Stratospheric aerosols contain significant amounts of metals released as satellites burn-up during re-entry, mass spectrometry high above Alaska has shown. While this fraction is expected to increase dramatically in the coming decades, the impact of these additional metals on atmospheric chemistry is unknown.
Aerosols in the upper atmosphere primarily comprise sulfuric acid from the condensation of oxidized carbonyl sulfide or sulfur dioxide with water vapour. These aerosols sometimes nucleate on metallic nanoparticles, which can naturally form by meteor ablation. ‘The meteors burn up very high in the atmosphere – like 100km,’ explains atmospheric scientist Daniel Murphy of the National Oceanic and Atmospheric Administration in Boulder, Colorado. Metals like iron and magnesium are vaporised from the meteors, and as the atoms undergo Brownian motion and cool, they condense into nanoparticles less than 100nm in size.
In the new research, Murphy and colleagues studied aerosols 19km above Fairbanks, Alaska in February and March this year using a specially-designed mass spectrometer mounted in the nose of NASA’s WB-57 high-altitude aircraft. As air descends during winter in polar regions, it becomes especially useful for sampling stratospheric composition from even higher altitudes. ‘We detect when a particle comes by seeing a flash of light as it crosses a continuous laser beam,’ says Murphy. ‘Then we quick hit it with a pulse from an excimer laser and look at the ions that come off – so it’s a tiny fraction of a second between when the particle’s in the outside world and when we analyse it.’
About 50% of the sulfuric acid aerosols contained metal cores, and the researchers found clear evidence of contamination from spacecraft debris in some of these. Approximately 10% showed unexpectedly high aluminium levels, and some contained exotic elements. Particles that showed niobium and hafnium did so in a ratio that matched the C-103 alloy in some rocket extensions. The correlation between enrichments of lithium and aluminium could be explained by the increased using of Al–Li alloys in spacecraft bodies and of lithium-ion batteries. Most of the stratospheric copper, a metal rare in meteors, is already thought to come from spacecraft.
The effects of this are unknown, but it seems certain the contamination will increase. ‘People are anticipating a huge, huge increase in re-entry events because of this constellation of low earth-orbiting satellites,’ says Murphy. ‘There’s thousands of satellites being launched now, and tens of thousands being planned … so if it’s 10% now that contain these metals, it’s very likely to be a much higher percentage in the near future.’
‘We don’t know whether there are any ways these metals could change these sulfuric acid particles, and in some ways that’s the uncomfortable part of the story,’ he adds. One possibility is that the metals could potentially affect the ways in which aerosols form clouds. ‘I think people in the laboratory are going to start looking into how much you change the properties of a sulfuric acid particle when there’s a little bit of aluminum and copper in it.’
Atmospheric chemist Sergey Nizkorodov of University of California, Irvine in the United States, who was not involved in the work, is impressed. ‘People knew that metals are produced in the upper atmosphere by breaking up meteorites: they considered natural meteorites obviously, but this is the first study to the best of my knowledge that looks at the decomposition of man-made objects, and apparently there is enough of them to make a difference. I think it’s a really good [study],’ he says. ‘Aluminum is a pretty benign metal but there is also copper they mention and other transition metals that could potentially have interesting chemistry related to the ozone layer or formation of clouds … I think it should be investigated, for sure.’
spacer
If you think that all the technology we see today has never been seen in previous eras you should really do some research. There is evidence of electricity, computers, flying vehicles and even alien beings way back in ANCIENT TIMES.
They keep erasing history so that they can keep repeating the same deceptions!
The DRUIDS were known to be able to manipulate the weather. Check out these excepts from Druidism; The Ancient Faith of Britain
spacer
According to legendary lore,the Druids could, by their magical powers, create clouds and mists and bring down showers of fire and blood.St. Patrick, on his way to Tara one Easter Sunday morning, chanted a hymn beseeching God to protect him against the spells of women, smiths, and Druids. In a contest which the Druids had at Tara with the celebrated Irish apostle, they are said to have caused snow to descend by means of their magical incantations.
Confused ideas are often held upon this subject of magic which does not mean deception, or cunning, or a skillful dexterity in hand-manipulation alone,though it is sometimes employed in one or other or all of these ways. Magic proper, however, means the understanding of nature, and it derived its name from the fact that this occult knowledge was
supposed to be the exclusive possession of the Magi, or wise men.The founder of Magic is claimed by the mythologists to have been Chus, the reputed founder of the Cuthites, who is also accredited by tradition to be the first to venture upon the high seas. The Greeks, however, claim that magical arts were invented in Persia, in which country the Magi applied themselves to the study of philosophy and the assiduous search after the most curious works and mysteries of Nature. These men were chosen generally to superintend divine worship and all religious rites and ceremonies ; they attended constantly upon kings to advise them in all affairs of moment and were chosen for the highest honours and places demanding the greatest trust and confidence. It was at a later stage in Persian history that their credit and esteem became diminished in consequence of their abandonment of the contemplation of nature and the betaking of themselves to the invocation of demons.The belief that magical powers were in the possession of certain individuals was retained, as will be seen, until well on in the Christian era. Sopater, the philosopher, and friend of Constantine, was accused of binding the winds in an adverse quarter by the influence of magic, so that warships could not reach Constantinople, and, in response to ecclesiastical clamour, the Emperor was compelled to issue the order for his decapitation.
Belief in witchcraft can be traced to Druidism, and some of the practices attributed to witches after all traces of Druidical worship and customs were supposed to have died out are nevertheless exact, or almost exact, reproductions of the practices attributed to the Druids by earlier authorities. More than one writer has stated that the Scottish witch is the direct descendant of the Druidess, and, according to Pomponius Mela, the Druidesses of the Isle of Sena could grant fair winds or raise tempests, and, in 1792, the author of the Statistical Account of the Hebrides stated that in the island of Gigha it was believed that by performing certain ceremonies at a fountain there, persons thus initiated into its mysteries could cause the wind to blow from any quarter desired.
spacer
With all their claims that they MAIN GOAL is to be better at predicting the weather, they just have not impressed me with their progress. For all the billions of dollars and time they have spent researching and all the data they have collected along with the AI algorithms and scenarios created by them you would expect much more.
If you are as old as I, you likely remember the Farmer’s Almanac. For many years Farmers and anyone who needed to know what to expect from the weather used this tool. It was AMAZINGLY Accurate, and served the public well. I would say as good if not much better than the current forecasts. And they forecast two weeks or more in advance. For some predictions years in advance.
In 1846: The Farmers Almanac was: America’s leading periodical by outselling and outlasting the competition.
by 1863: The Almanac had a circulation of : 225,000!
in 1938: The edition had a circulation of only 88,000, because the new editor dropped the weather forecasts! In their place, he substituted temperature and precipitation averages.
in 1939: The Old Farmer’s Almanac had a new owner and editor and immediately reestablished its format and editorial style
in the early 1990s: The Almanac passed the four million circulation mark
In 2000: The Old Farmer’s Almanac moved firmly into the digital age: Almanac.com has 84 million unique visitors, reaching 1 in every 6 Americans, and 1 in 5 Canadians, online.
Before the era of modern weather forecasting, it was the best resource for farmers in keeping abreast of seasonal weather shifts, planting times, and other general agriculture reference points.
Two years ago, NPR examined the accuracy of the “Old Farmers Almanac” and, citing a study by Penn State meteorologist Paul Knight, found that it just wasn’t up to snuff. “It’s just not possible to do that consistently,” he told NPR. Source
spacer
Published since 1792, the publication occupies a cultural space that now includes weather apps, GPS, and websites.

Before the Internet—and I mean long, long, long before the Internet—an almanac was a radical, high-tech object.
It must have seemed, to the people of the 1792, when The Farmer’s Almanac was founded, something like what a smartphone is to people today: a handheld, portable device that contained information about all manner of things—health advice, weather predictions, jokes, recipes, charts detailing the times of sunrises and sunsets, and other “new, useful, and entertaining” tidbits, as the cover promised.
How Does The Farmers’ Almanac Predict The Weather?
Farmers’ Almanac has been providing accurate long-range weather forecasts since 1818. But have you ever wondered how these forecasts are made? It’s all in the formula.

The Farmers’ Almanac is a well-known publication that has been around for centuries. It is widely respected for its accurate weather predictions and forecasts. But how does the Farmers’ Almanac predict the weather?
One essential factor that we consider in our extended weather forecasts is the influence of our celestial companion, the Moon. As students of meteorology know, the Sun’s rays warm Earth’s atmosphere, leading to the exchange of heat and vapor between the surface and the air. This produces the weather phenomena we experience and call “weather.” The Moon acts as a “meteorological swizzle stick,” occasionally stirring up atmospheric disturbances with its cyclical and predictable movements.
In addition to studying natural cycles, meteorologists also use the technique of comparing past weather patterns to current conditions to forecast future weather. This approach, known as analog forecasting, provides valuable insights into potential weather events.
The Farmers’ Almanac Weather Formula
The Farmers’ Almanac weather predictions are based on a formula originally developed in 1818 by our foundering editor, David Young. This formula incorporates many of the various techniques mentioned here, as well as sunspot activity, tidal action of the Moon, the position of the planets, and more. To safeguard this valuable formula, the editors of the Farmers’ Almanac keep its weather prognosticator – Caleb Weatherbee- identity and the exact formula as brand secrets.
While some may question how a publication that started over 200 years ago can make such accurate extended weather forecasts, the Farmers’ Almanac editors like to remind everyone that this formula has been time-tested, challenged, and approved for centuries. The Farmers’ Almanac is the oldest source of consecutively published weather forecasts, even longer than the National Weather Service.
Unlike your local news, government, or commercial weather service, the Almanac’s forecasts are calculated two years in advance. Once the new edition is printed, the editors never go back to change or update its forecasts the way other local sources do.
Though weather forecasting, and long-range forecasting, in particular, remains an inexact science, many longtime Almanac followers maintain that our forecasts are 80% to 85% accurate.
spacer
EL NINO
1986-1987, 1991-1992, 1993, 1994, 1997-1998 and 2015-2016. The rapid succession of El Niños beginning in the early 1990’s was unusual. La Niña, where the water is cooler than normal, is indicated by blue colors.
What is La Niña?
For ENSO, that period is typically between 3 and 7 years. Its opposite counterpart is El Niño, which has warmer-than-normal (0.5°C or greater) sea surface
“probably a better option” when describing the phenomenon behind a bomb cyclone, mentions of bombs and explosive impacts have been common for decades among meteorologists.
The National Oceanic and Atmospheric Administration defines the “bomb” phenomenon as being a mid-latitude cyclone that rapidly intensifies as cold air collides with warm air, typically over warmer ocean waters. This process causes a steep drop in atmospheric pressure of at least 24 millibars over 24 hours. Source
Bomb cyclone:
The related terms “bomb cyclone” and “weather bomb” emerged in the mid-1980s, but only recently made their way into popular journalism. Two MIT scientists, Frederick Sanders and John R.Gyakum, gave these intense and rapidly growing cyclone storms the name “bomb.”
spacer
Bombogenesis
What is bombogenesis?
In simple terms, bombogenesis is a storm (low pressure area) that undergoes rapid strengthening. The vast majority of such storms occur over the ocean. The storm can be tropical or non-tropical in nature.
Other common phrases for bombogenesis include weather bomb, or simply bomb cyclone.
The term bombogenesis comes from the merging of two words: bomb and cyclogenesis.All storms are cyclones, and genesis means the creation or beginning. In this case, bomb refers to explosive development. Altogether the term means explosive storm strengthening.
A cyclone (non-tropical storm or hurricane) is essentially a giant rising column of air that spins counterclockwise over the Northern Hemisphere.
The Superstorm of 1993 (Storm of the Century) from March 12-13 is a prime example of a storm that underwent bombogenesis. The storm strengthened from 29.41 inches (996 mb) to 28.45 inches (963 mb), or nearly 1.00 inch (33 mb), in 24 hours. Much of this strengthening occurred over land.
These are all terms that the general public had not even heard of in my generation. And it is funny that all these changes have occurred since WWII… the same time as all the changes in our DNA and in our FOOD. At the same time as all the new Technology that has taken over our lives. The same time as the Hadron Collider.