MONEY is the ROOT of all EVIL. Oil is the same as Money and that is why the Oil Industry is SO CORRUPT! It has been the source of so many wars, murders, military coups, betrayals, seductions, desertions, abandonments, suicides, intrigues, thefts, and broken promises/commitments than anything. The Oil Industry has committed so many crimes against our Environment and our Population it could never repay us with all the money the industry has ever produced.
AND it is far from over. Before the end of the world as we know it, they will mutiply their crimes several times over. If you add the CHEMICAL pollution for all the chemicals made from Oil byproducts and all the Trash produced from the use of those products, I would have to say that the OIL INDUSTRY is the NUMBER 1 contributor to the destruction of our Environment.
But, this section of the Series is focused only on Oil Production and Oil exploration. Let’s take a look.
Oil and Gas Fracturing, Drilling and Production Chemicals, Waste and Environmental Impacts
December 3rd 2013
David A. Calvert, Ph.D/President/ CEO Eco Compounds
Director Environmental Health and Safety
True Oil Enterprises
Discussion
-
*EPA Exemption of Oil and Gas Waste
*Use of Greener Chemicals*Disposal Options*Chemicals in Waste*Water Volumes*Sources of Contamination*Waste Management
EPA EXEMPTION
OIL AND GAS WASTE
The Resource Conservation and Recovery Act (RCRA), enacted in 1976, is the principal federal law in the United States governing the disposal of solid waste and hazardous waste.
RCRA, Subtitle D, places Oil and Gas waste in the same category as household hazardous waste and coffee grounds.
Non-Hazardous Oil and Gas Drilling and Production Waste
Wastes generated by the exploration, development, and production of crude oil and natural gas are “exempt” by Federal law from being regulated as hazardous waste per RCRA Subtitle C.
The exemption for oil and gas exploration and production waste is codified at 40 C.F.R. 61.4 (b)(5). Therefore, oil and gas wastes are referred to as “non-hazardous” and must be regulated at the state level.
The Solid Waste Disposal Act of 1980 prohibits EPA from regulating drilling fluids, produced water and other waste associated with the exploration, development or production of crude oil or natural gas as RCRA Subtitle C (hazardous waste.)Associated Waste
Completion Fluids
Production Pit / Storage Tank Sludges
Produced Oily Sands and Solids
Washout Water and Sludge from Tank Cleaning
Environmental Protection Agency
Exempt Oil and Gas Waste Categories
* Large Volume Waste
* Produced Waters
* Drilling Fluids
* Drilling CuttingsAssociated Waste:
* Completion Fluids
* Production Pit / Storage Tank Sludges
* Produced Oily Sands and Solids
* Washout Water and Sludge from Tank CleaningA SIMPLE RULE
A simple rule of thumb can be used to determine if an E&P waste is exempt from RCRA Subtitle C regulations:
1. Has the waste otherwise been generated by contact with the oil and gas production stream during the removal of produced water or other contaminants from the product?
2. Has the waste come from down-hole, i.e., was it brought to the surface during oil and gas E&P operations?
Just because oil and gas wastes are exempt from being regulated as hazardous waste, does not mean that the waste does not pose a hazard to workers and community members living in close proximity to the drilling, production and waste handling sites.
Sources of Environmental Contamination
Groundwater, surface water, soil, sediments and air are impacted by:* Fracturing which can create pathways that can allow migration into other non-target formations.
* Leaks and spills which can occur from injection wells, flow lines, pipelines, pits, tanks, chemical storage containers, drums and trucks.
* Road spreading and land spreading can introduce contaminants into the environment.
* Discharges into surface water resources of waste water not meeting permit limits.
June 25, 2009 – Louisiana
Hydraulic fracturing was occurring at a well site in the Haynesville Shale and production fluids ran off-site.
40 beef cows with calves were grazing in the pasture next to the drill rig.
The pasture fence was 150’ from the drill rig.
19 cattle died after ingesting white, milky fluid in rainwater puddles in the pasture.The cattle were foaming at the mouth, billowing and had bleeding tongues prior to their deaths.
The same white milky fluid was present in puddles on the rig site.
During the hydraulic fracturing process, yellow-green fumes were being released into the air and deposited on the ground around the drill rig and in the pasture.
Examples such as this stimulate the need for Eco-Friendly alternatives to the current chemicals used in the industry today.We have responsibility to:
* Ensure protection of ground water and surface water resources and prevent contamination of soil and water resources.
* Develop regulations for fracturing and re-fracturing.
* Develop efficient and effective Eco-Friendly compounds to substitute for the current toxic or hazardous chemicals.
* Have Buffer zone, set back and exclusion zones for well sites, compressors and tank batteries from water bodies, water wells, homes, businesses, buildings, schools, and park.WATER VOLUMES
So how much waste are we talking about?
Large quantities of water usage and wastewater production during drilling and fracturing process.
The use of large quantities of surface and groundwater can deplete and degrade shallow drinking water aquifers and surface water resources.
Shale fracturing requires:
* 1.2 million gallons of water for each Vertical well
* 3.5 million gallons of water for each Horizontal well
Each million gallons of hydraulic fracturing fluid contains @ 40,000 pounds of chemicals.
Thus a vertical well would have 48,000 pounds (approximately 6000 gallons) of chemicals in the fracturing fluid.
A horizontal well would have 140,000 pounds of chemicals (approximately 17,500 gallons).
20 to 30% of hydraulic fracturing flow back wastewater remains underground. The flow back water contains large quantities of the chemicals used in the fracturing process.
Fracturing Process Waste
The fluids necessary for the fracturing process is described as flow-back water and is contaminated with fracturing chemicals and fluids.
Fracturing fluids consist of :
• Surfactants
• friction reducing chemicals
• biocides
• scale inhibitors
• propping agents
Gas Process Waste
In natural gas production the wastewater generated is known as
produced water and is contaminated with:
• volatile organic chemicals
• toxic heavy metals
• sulfur containing compounds
• NORM – Radioactive Radium 226 and 228
• salt water minerals
The toxic heavy metals consist of arsenic, barium, cadmium,
chromium, lead, mercury, and vanadium which are known,
possible and probable human cancer causing agents.
The volatile organic chemicals consist of:
• Benzene – a known human cancer causing agent and other
organic chemicals
Possible and probable human cancer-causing agents and mutagens.
• Toluene
• Ethyl Benzene
• Xylene
 The Resource Conservation and Recovery Act (RCRA), enacted in 1976, is the principal federal law in the United States governing the disposal of solid waste and hazardous waste.
 Environmental Protection Agency


 So how much waste are we talking about?
![]()
OIL AND GAS WASTES ARE RADIOACTIVE! WHY DOESN’T THE EPA CARE?
Highlighting maps created in collaboration with the Western Organization of Research Councils of radioactive oil and gas exploration and production wastes.
By Kyle Ferrar, MPH, Western Program Coordinator, FracTracker Alliance
Scott Skokos, Regional Organizer, Western Organization of Research Councils
The FracTracker Alliance has been working with the Western Organization of Resources Councils (WORC) to map out exactly where the radioactive oil and wastes are being dumped, stored, and injected into the ground for disposal. This work follows up on WORC’s comprehensive No Time to Waste report. In this blog report, we summarize some of the many issues that comprise the hazardous risks resulting from the current federal policy that fails to regulate this massive waste stream. Of the six states mapped in this assessment, North Dakota has finalized weak rules managing oil and gas waste (Note: North Dakota’s rules are in litigation and not being enforced), and Montana is initiating a rule-making process to manage the waste. All states need to consider this waste stream to address the issue since the U.S. Environmental Protection Agency and federal government refuses to.
According to Nadia Stenizor of Earthworks, when it comes to unconventional oil and gas waste streams, “Nobody can say how much of any type of waste is being produced, what it is, and where it’s ending up.” The Earthworks report, Wasting Away, explains that the EPA intentionally exempts oil and gas exploration and production wastes from the federal regulations known as the Resource Conservation and Recovery Act (RCRA) despite concluding that such wastes “contain a wide variety of hazardous constituents.” As a result of this dismissal of accountability, there is very little waste tracking and reporting of data. Regardless, we at FracTracker have compiled, cleaned and mapped what little data is available.
State-specific maps have been created for Colorado, Montana, North Dakota, and Wyoming. To see the maps, select the link to the state of interest below!
SOURCES OF RADIOACTIVITY
When we hear “radioactive waste” associated with the energy industry, nuclear power stations and fission reactors are usually what comes to mind. But, as the EPA explains, fracking has transformed the nature of the oil and gas waste stream. Components of waste stream are different from conventional oil and gas exploration and production wastes. In general the waste stream has additional hazardous components and that transformation includes increased radioactivity. Fracking has allowed for more intrusive drilling, penetrating deep sedimentary formations using millions of gallons of fluid. Drilling deeper produces more drill cuttings, and hydraulic fracking introduces millions more gallons of fluid that are ultimately contaminated and require disposal. While industry may contend that fracking fluid is mostly water – as we know from basic chemistry, water is the universal solvent.
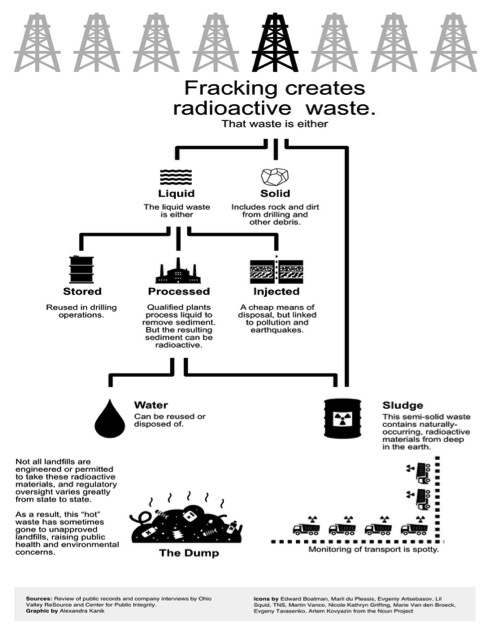
The formations targeted for unconventional development are mostly ancient sea-beds still filled with salty “brines” known as “formation waters.” In addition, the hazardous chemicals in the fracking fluid pumped into the wells for fracking, these unconventional formations contain larger amounts of heavy metals, carcinogens and other toxics. This also includes radioisotopes such as uranium, thorium, radium, potassium-40, lead-210, and polonium-210 than the conventional formations that have supplied the majority of oil and gas prior to the shale boom. A variety of waste products make up the waste stream of oil and gas development, and each is enhanced with naturally occurring radioactive materials (NORM). This waste stream must be treated and disposed of properly, and all the oil and gas equipment, such as production equipment, processing equipment, produced water handling equipment, and waste management equipment also need to be considered as sources of radioactive exposure. Figure 1 provides a summary of waste production that results from fracking and the options for disposal. Three articles of the waste stream particularly enhanced with naturally occurring radioactive materials by the technological process of fracking include scales, produced waters, and sludges.
Figure 1. Breakdown of the radioactive oil and gas waste life-cycle
SCALES
The fracking fluid mixes with “formation waters,” dissolving metals, radioisotopes and other inorganic compounds. Additionally, the fracking liquids are often supplemented with strong acids to reduce “scaling” from precipitate build up. Regardless, each oil well generates approximately 100 tons of radioactive scale annually and as each oil and gas reservoir drained, the amount of scale increases. The EPA reports that lead-210 and polonium-210 are commonly found in scales along with their decay product radon at concentrations estimated to be anywhere from 480 picocuries per gram (pCi/g) to 400,000 pCi/g). Scale can be disposed of as a solid waste, or dissolved using “scale inhibitors”. These radioactive elements then end up in the liquid waste portion, known as produced waters.
PRODUCED WATERS
In California, strong acids are even used to further dissolve formations to stimulate additional oil production. Acidic liquids are able to dissolve more inorganic elements and compounds such as radioisotopes. While uranium and thorium are not soluble in water, their radioactive decay products such as radium dissolve in the brines. The brines return to the surface as “produced water.” As the oil and gas in the formation are removed, much of what is pumped to the surface is formation water. Consequently, declining oil and gas fields generate more produced water. The ratio of produced water to oil in conventional well was approximately 10 barrels of produced water per barrel of oil. According to the American Petroleum Institute (API), more than 18 billion barrels of waste fluids from oil and gas production are generated annually in the United States. There are several options for the liquid waste stream that include certain waste treatment facilities or the cheaper option of reinjection for “enhancement” of production, or injection for disposal. Before disposal of the liquid portion, all the solids in the solution are removed, resulting in a “sludge.”
SLUDGES
The EPA reports that just conventional oil production process produce 230,000 MT or five million ft3 (141 cubic meters) of TENORM sludge each year. Unconventional processes produce much more sludge waste than conventional processes. The average concentration of radium in sludges is estimated to be 75 pCi/g, while the concentration of lead-210 can be over 27,000 pCi/g. Sludges present a high risk to the environment and a higher risk of exposure for people and other receptors in those environments because they are typically very water soluble.
FEDERAL EXEMPTIONS
According to the EPA, “because the extraction process concentrates the naturally occurring radionuclides and exposes them to the surface environment and human contact, these wastes are classified as Technologically Enhanced Naturally Occurring Radioactive Material (TENORM).” Despite the conclusions that oil and gas TENORM pose a risk to the environment and humans, the EPA exempts oil and gas exploration and production wastes from the definition of hazardous under Resource Conservation and Recovery Act (RCRA) law. In fact, most wastes from all of the U.S. fossil fuel energy industry, from coal-burning to natural gas, are exempt from the disposal standards of hazardous waste that would otherwise be required. The Center for Public Integrity calls the radioactive waste stream “orphan waste” because no single government agency is fully managing it.
Fortunately, the EPA has acknowledged that federal regulations are currently inadequate. But this is nothing new. An EPA report from the 1980’s reported as much, and gave explicit recommendations to address the issue. For 30 years nothing happened! Then in August, 2015, a coalition of environmental groups (including the Environmental Integrity Project, Natural Resources Defense Council, Earthworks, Responsible Drilling Alliance, West Virginia Surface Owners’ Rights Organization, and the Center for Health, Environment and Justice) filed a lawsuit against the EPA, and has since reached a settlement. Just last month (January 10, 2017) the EPA agreed to review federal regulations of oil and gas waste, a process they were meant to do every 3 years for the last 30 years. The EPA has until March 15, 2019 to determine whether or not regulatory changes are warranted for “wastes associated with the exploration, development, or production of crude oil, natural gas, or geothermal energy.” With the recent freeze on all EPA grants, it is not clear whether these regulations will receive the review they need.
STATE REGULATIONS
Regulation of this waste stream is left up to the states, but most states do not require operators to manage the radioactivity in oil and gas wastes either. Because of the RCRA exemptions, most state policies ignore the radioactive issue altogether. Operators are free to dispose the waste at any landfill facility, unless the landfill tells them otherwise. Because of the RCRA exemptions states either lack regulatory programs or at best have various piecemeal regulatory programs aimed low level radioactive waste disposal. For detailed analyses of state policies, see pages 10-45 of WORC’s No Time to Waste report.
Another issue that screams for federal consideration of this waste stream is that states do not have the authority to determine whether or not the wastes can cross their borders. Neither do they have the jurisdiction to decide whether or not facilities in their state accept waste from across state lines. That determination is reserved for federal jurisdiction, and there are not any federal laws regulating such wastes. In fact, these wastes are strategically exempt from federal regulation for just these reasons.
WHY CAN’T THE WASTE BE TREATED?
This type of waste actually cannot be treated, at least not entirely. Unlike organic pollutants that can be broken down, inorganic constituents of the waste such as heavy metals like arsenic or bromides, and radioactive isotopes of radium, lead, and uranium cannot be simply disintegrated out of existence. These elements will continue to emit radiation for hundreds to thousands of years. The best option is to find a location to “isolate” these wastes that will be a sacrifice zone… forever.
Current practices do their best to separate the liquid portions from the solid portions but that’s about it. Each portion can then be disposed independently of each other. Liquids are injected into the ground, which is the cheapest option where available. If enough of the dissolved components (heavy metals, salts, and radioisotopes) can be removed, wastewaters are discharged to surface waters. The compounds and elements that are removed from the liquid waste stream are hyper-concentrated in the solid portion of the waste, described as “sludge” in the graphic above. This hazardous material can be disposed of in municipal or solid waste landfills if the state regulators do not require the radioactivity or toxicity of this material to be a consideration for disposal. There are no federal requirements, so unless there is a specific state policy regarding the disposal, it can end up almost anywhere with little oversight. These chemicals do not magically disappear. They never disappear. At best, the industry simply puts them in a big landfill where they will remain forever.
RISKS
There are multiple pathways for contamination from facilities that are not qualified to manage radioactive and hazardous wastes. At least seven different environmental pathways provide potential risks for exposure. They include radon inhalation, external gamma exposure, groundwater ingestion, surface water ingestion, dust inhalation, food ingestion, and skin beta exposure from particles containing the radioisotopes. According to the EPA, the low-level radioactive materials in drilling waste present a definitive risk to those exposed. High risk examples include dust suppression and leaching. If dust is not continuously suppressed, radioactive materials in dust become harmful to those located on-site of these facilities or those receptors or secondary pathways located downwind of the facilities. Radioactive leachate entering surface waters and groundwaters is also a significant threat. A major consideration is that radioactive waste can last in these landfills far longer than the engineered lifespans of landfills, particularly those that are not designed to retain hazardous wastes.
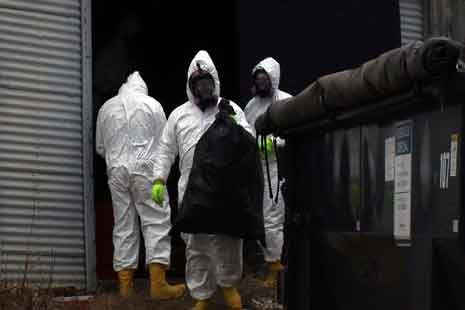
CASES OF CONTAMINATION
NORTH DAKOTA
In North Dakota, the epicenter of the Bakken Oil Fields, regulators were not ready for the massive waste streams that came from the fast growing oil fields. This allowed thousands of wastewater disposal wells be drilled to dispose of salty wastewater without much oversight, and no places in state for companies to dispose of radioactive solid waste. Many of the wastewater disposal wells were drilled haphazardly, and as a result many contaminated surrounding farmland with wastewater. With regard to radioactive solid waste, the state until recently had a de facto ban on solid radioactive waste disposal due to their radioactivity limit being 5 picocuries per gram. The result of this de facto ban made it so companies either had to make one of two decisions:
- Haul their radioactive solid waste above the limit out of state to facilities in Idaho or Colorado; or
- Risk getting caught illegally dumping waste in municipal landfills or just plain illegal dumping in roadsides, buildings, or farmland.
In 2014, a massive illegal dumping site was discovered in Noonan, N.D., when North Dakota regulators found a gas station full of radioactive waste and filter socks (the socks used to filter out solid waste from wastewater, which contain high levels of radioactivity). Following the Noonan incident, North Dakota regulators and politicians reacted to public pressure and began discussions regarding the need for new regulations to address radioactive solid waste.
In 2015, North Dakota moved to create rules for the disposal of solid radioactive waste. Its new regulations increased the radioactivity limit from 5 picocuries per gram to 50 picocuries per gram, and set up new requirements for the permitting of waste facilities accepting radioactive waste and the disposal of radioactive waste in the waste facilities. Dakota Resource Council, a member group of WORC, challenged the rules in the courts, arguing the rules are not protective enough and that the agency responsible for the rules pushed through the rules without following the proper procedures. Currently the rules are not in effect until the litigation is settled.
PENNSYLVANIA
In Pennsylvania, the hotbed of activity for Marcellus Shale gas extraction, the regulatory system was ill equipped and uninformed for dealing with the new massive waste stream. Through 2013, the majority of wastewater was disposed of in commercial and municipal wastewater treatment facilities that discharge to surface waters. Numerous facilities engaged in this practice without amending their federal discharge permits to include this new waste stream.
Waste treatment facilities in Pennsylvania tried to make the waste streams less innocuous by diluting the concentrations of these hazardous pollutants by diluting the fracking wastes with other waste streams, including industrial discharges and municipal waste. Other specialized facilities also tried to remove these dissolved inorganic elements and filter them from the discharge stream. As a result of site assessments by yours truly and additional academic research these facilities came to the conclusion that hazardous compounds do not simply dilute into receiving waters such as the Allegheny, Monongahela, and Ohio Rivers. Instead they partition into sediments where they are hyper-concentrated. As a result of the lawsuits that followed the research, entire river bottoms in Pennsylvania had to be entirely dug up, removed, and disposed of in hazardous waste landfills.
Massive amounts of solid and liquid wastes are still generated during drilling exploration and production from the Marcellus Shale. There is so much waste, operators don’t know what to do with it. In Pennsylvania, there is not much they can do with it. And it is not just Pennsylvania. Throughout the Ohio River Valley, operators in Ohio and West Virginia struggle to dispose of this incredibly large waste stream. Ohio, West Virginia and Pennsylvania have all learned that this waste should not be allowed to be discharged to surface waters even after treatment. So it goes to other states! These states are without production or the regulatory framework to manage the wastes. Like every phase of production in the oil and gas industry, operators (drillers) shop around for the lowest disposal costs. In Estill County, Kentucky, the State Energy and Environment Department just recently cited the disposal company Advance Disposal Services Blue Ridge Landfill for illegally dumping hydraulic fracturing waste. The waste had traveled from West Virginia Marcellus wells, and ended up at an ignorant or willfully negligent waste facility.
Read more stories about oil and gas here.
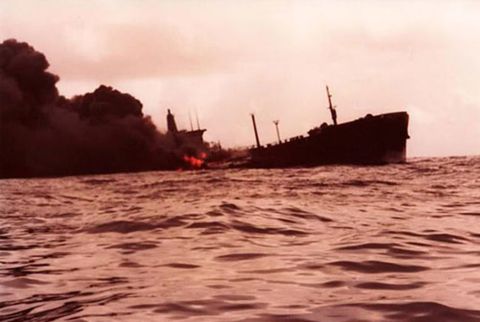
10 Biggest Oil Spills in History
The Deepwater Horizon spill could easily pump 20 million gallons of oil into the Gulf of Mexico. While this is almost double the amount spilled by the Exxon-Valdez, it’s nowhere near the top 10 biggest spills of all time.
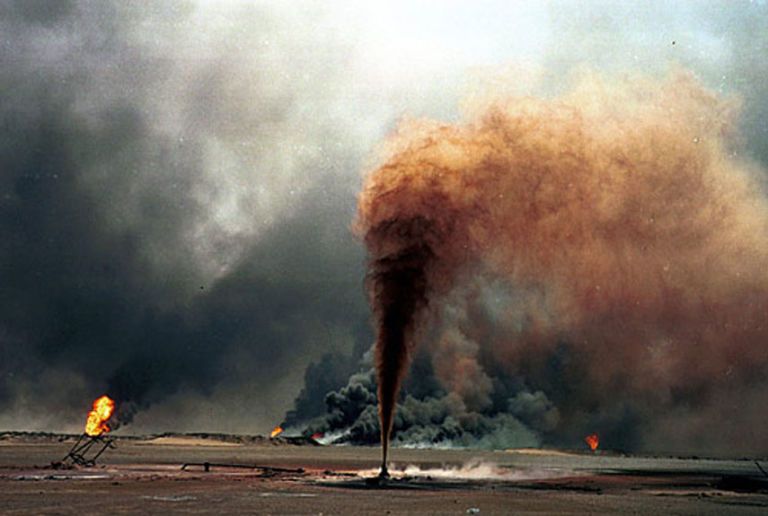 Gulf War, 1991
How It Happened:
As Iraqi forces retreated from Kuwait during the first Gulf War, they opened the valves of oil wells and pipelines in a bid to slow the onslaught of American troops. The result was the largest oil spill history has seen. Some 240 million gallons of crude oil flowed into the Persian Gulf. The resulting oil slick spanned an area just larger than the size of the island of Hawaii.
The Cleanup:
Coalition forces managed to seal off some of the open pipelines using smart bombs, but most recovery efforts had to wait until after the war. At that point 25 miles of booms (orange ropelike products that contain the oil that is floating on top of the water) and 21 skimmers (machines that separate oil from water) were deployed in the gulf, mostly to protect the water intakes of desalinization, industry and power plants. Together with vacuum trucks, about 58.8 million gallons of oil was recovered from the gulf.
The largest oil spill the world has seen exacted little permanent damage on coral ecosystems and local fisheries, according to a report by the Intergovernmental Oceanographic Commission at Unesco. The study concluded that about half the oil evaporated, one-eighth of it was recovered and another quarter washed ashore, mostly in Saudi Arabia.
 Ixtoc 1 Oil Well, 1979
How It Happened:
In June 1979, an oil well in the Bay of Campeche collapsed after a pressure buildup sparked an accidental explosion. Over the next 10 months about 140 million gallons of crude spouted into the Gulf of Mexico from the damaged oil well.
The Cleanup:
In order to slow down the flow of oil from the damaged well, mud and later steel, iron and lead balls were dropped down its shaft. According to PEMEX (Mexican Petroleum), half the oil burned when it reached the surface and a third evaporated. PEMEX also hired a company to spray dispersants over 1100 square miles of oil slick. Dispersants effectively act like dish soap, breaking up oil so that more of it can mix into the water. That way, they can reduce the effect of the oil slick on shorelines. On the Texas side of the gulf, skimmers and boomers were placed in the water to protect the bays and lagoons of the Barrier Islands.
 Atlantic Empress, 1979
How It Happened: One stormy evening in July 1979, two full supertankers collided off the coast of Tobago in the Caribbean Sea, precipitating the largest ship-sourced oil spill in history.
Crippled by the accident, both vessels began to leak their crude and caught fire. The fire on one of the vessels, the Aegean Captain, was soon controlled, and the damaged vessel was towed to Curacao, where its remaining cargo was recovered.
The other tanker, the Atlantic Empress, stubbornly ablaze, was towed farther out to sea until it exploded 300 nautical miles offshore.
All told, 26 crew were killed in the disaster and nearly 90 million gallons of crude was dumped into the sea.
The Cleanup: The response to the incident included firefighting efforts and the use of dispersants to treat the oil that spilled over the course of the accident and then while the Atlantic Empress was towed away. Luckily, only minor shore pollution was reported on nearby islands.
 Fergana Valley, 1992
How It Happened:
Nearly 88 million gallons of oil spilled from an oil well in Fergana Valley, one of Uzbekistans’s most active energy- and oil-refining areas. While the spill didn’t get much press at the time, it is the largest inland spill ever reported.
The Cleanup:
The ground absorbed this spill, leaving nothing for cleaning crews to tackle.
 Nowruz Oil Field, 1983
How It Happened:
Smack in the middle of the Iran-Iraq War, an oil tanker crashed into the Nowruz Field Platform in the Persian Gulf and knocked it askew, damaging the well underneath. The oil well then leaked about 1500 barrels a day, but because it was in the center of a war zone, seven months went by before it was fixed.
The Cleanup:
Norpol, a Norwegian company, used booms and skimmers to stem the spread of oil.
 ABT Summer, 1991
How It Happened:
While en route to Rotterdam, the fully loaded tanker ABT Summer experienced an explosion onboard and caught fire while it was 900 miles off the coast of Angola, leaking its payload into the ocean.
Surrounded by a growing oil slick that spanned 80 square miles, the tanker burned for three days before sinking.
The Cleanup:
While no one can say how much of the oil sank or burned off, most of the oil is thought to have been broken up by high seas at little environmental cost, thanks to the incident’s offshore location.
 Castillo de Bellver, 1983
How It Happened:
Another torcher, the Castillo de Bellver caught fire about 70 miles northwest of Capetown, South Africa, on August 6, 1983. The blazing tanker was abandoned and drifted offshore until it eventually broke in half. The stern capsized and sank into the deep ocean, with some 110,000 ton of oil remaining in its tanks. The bow section was towed away and sunk in a controlled explosion.
The vessel was carrying nearly 79 million gallons of crude at the time of the accident.
The Cleanup:
Cleanup was minimal. There was some dispersant spraying, but by and large the environmental consequences were small. About 1500 gannets that happened to be gathered on a nearby island, gearing up for their breeding season, were oiled, but the impact on local fish stocks was minimal.

How It Happened:
The tanker Amoco Cadiz ran aground off the coast of Brittany after its steering failed in a severe storm. Its entire cargo of 246,000 tons of light crude oil was dumped into the roiling waters of the English Channel, with the grim consequence of killing off more marine life than any other oil spill to date at the time.
The Cleanup:
Cleanup efforts were foiled by strong winds and heavy seas and less than 3300 tons of dispersants were used. Within a month of the spill, 200 miles of the French shoreline was contaminated with oil. Vacuum trucks and agricultural vacuum units were used to suck up some of the oil, although a lot of it was simply removed by hand.

How It Happened:
In November 1988 the Liberian tanker Odyssey, virtually full to the brim with North Sea crude oil, broke in two and sunk in the North Atlantic 700 miles off the coast of Nova Scotia. It also caught fire as it sunk.
The Cleanup:
Because the incident took place so far from the coastline, the oil was expected to dissipate naturally, ergo no clean up at all.

How It Happened:
An apparently shoddily maintained tanker exploded and later sunk off the coast of Italy. The accident killed six people.
Immediately after the incident, an effort by the Italians to tow the Haven to shore failed, and the 820-foot-long (250 meter) vessel sunk off the coast of Genoa. Today it is believed to be the largest shipwreck in the world and is a popular tourist destination for divers.
The Cleanup:
Immediately after the incident, Italian authorities scrambled to fight the fire and control the spread of the spillage using six miles of inflatable barriers that were submerged below the water surface around the vessel. The rest of the surface oil was sucked up using vacuums.
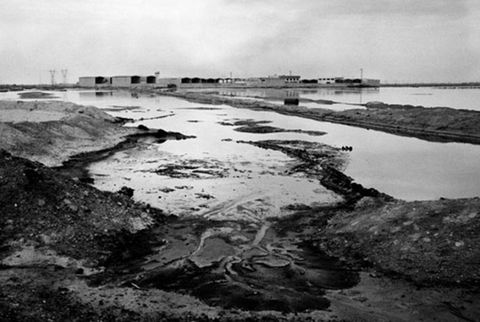
Oil spill still leaking into the Gulf of Mexico 15 years later
By CBS NEWS March 15, 2019, 6:43 PM
Port Eads, La. — In 2004, Hurricane Ivan plowed across the Gulf of Mexico and triggered an oil spill that is still leaking. It’s the longest continuous oil spill in American history.
Captain Rick Jiannuzzi took CBS News to where the Taylor oil rig once stood.
“Wherever it looks smooth, that’s all the sheen,” he said.
From the air, that sheen is visible for miles and you can even see it from space. Fifteen miles out, you can also smell it.
In 2004, Hurricane Ivan destroyed the MC20 oil platform operated by Taylor Energy. The company has spent over $400 million working alongside the U.S. Coast Guard to contain and clean up the spill which Taylor estimates has been leaking at a rate of about ten gallons a day for years.
But Florida State oceanographer and oil spill expert Ian MacDonald, who has studied the site for the government using underwater technology, thinks the leak is closer to 96 barrels a day. MacDonald convinced the Coast Guard that more oil is leaking than previously thought.
“We’re talking about coming up on half a million barrels of oil,” he said. “What’s happening now is the Coast Guard and the government is saying wait a minute, we’re going to take charge because we think that you’re underestimating the amount of oil.”
In a statement to CBS News, the company said, “Taylor Energy is raising the alarm about the junk science the Coast Guard is now using to justify activities that could destabilize the site.”
The Coast Guard is now working with a private contractor to cap the well and will demand Taylor Energy pay the bill. But the fight over the spill has moved from the Gulf to a courtroom because Taylor has pursued legal action to block the containment.
Until the leak is stopped and the courtroom battle ends, we won’t know how the spill will affect the marshlands or the fish and wildlife.
© 2019 CBS Interactive Inc. All Rights Reserved.
https://www.cbsnews.com/video/oil-spill-still-leaking-into-the-gulf-of-mexico-15-years-later/

![]()
Roger Harrabin answers a reader’s question on if fracking affects the water supply. … far deeper than the water-bearing rocks (aquifers) from which we get our water supplies.
Editor’s note March 30, 2016: For our latest reporting on fracking and drinking water contamination, read “Fracking Study Finds Toxins in Wyoming Town’s Groundwater and Raises Broader Concerns …
Fracking is destroying U.S. water supply, warns shocking new study Toxic wastewater from fracking jumps 14-fold from 2011 to 2016 — and it may get 50 times bigger by 2030.
In fact, water is involved in every stage of the fracking cycle. It starts with water acquisition. Oil and gas companies draw water from the local water supply in massive quantities to be used for fracturing underground shale rock. Next, that water is mixed with various chemical additives that will help it break up that rock.
Because of lax regulation, fracking companies commonly dispose of contaminated fracking water in the cheapest, easiest ways they can find, regardless of the consequences for communities, watertreatment facilities, and the environment. This has led to abuses of waterways and communities close to frack sites.
So that leaves us with a three-fold attack on the American water supply: There is the growing threat of water shortages from climate change, a problem that could be irreversible; The over-consumption of water from the natural gas industry; And the threat that private corporations pose when they try to take over our water.
America’s oil and gas rush is depleting water supplies in the driest and most drought-prone areas of the country, from Texas to California, new research has found.. Of the nearly 40,000 oil and …
LETTER TO THE EDITOR . Sir – The upcoming town council by-election could lead to a change of council position on the new and controversial form of shale gas fracking. Many of the candidates are responding positively to a short survey that asked if they would work to protect the Alice Springs’ drinking water supply from shale gas fracking.
The entire fracking process — from drilling a well to dealing with the resulting toxic waste — endangers our water and the health of our communities. There is clear evidence of the growing damage caused by fracking: Fracking makes people sick.
weather.info has been visited by 1M+ users in the past month
As federal policy makers decide on rules for fracking on public lands, a new report calculates the toll of this dirty drilling on our environment, including 280 billion gallons of toxic wastewater generated by fracking in 2012—enough to flood all of Washington, DC, in a 22-foot deep toxic lagoon.
Many of these costs are likely to be borne by the public, rather than the oil and gas industry. And as with the damage done by previous extractive booms, the public may experience these costs for decades to come. The case against fracking is compelling based on its damage to the environment and our health alone.
With the recent confirmation by the U.S. government that the fracking process … respiratory and neurological damage due to ingested … taken between 1987 and 2013 done in over 860,000 buildings …
In states where fracking is already underway, an immediate moratorium is in order. In all other states, banning fracking is the prudent and necessary course to protect the environment and public health. Read more: Groundbreaking Report Calculates Damage Done by Fracking
The text on this site is presented as an archival version of the script of “Ocean Planet,” a 1995 Smithsonian Institution traveling exhibition. The content reflects the state of knowledge at the time of the exhibition, and has not been updated.
![]()
The information on this buoy is divided into the three categories listed below.
![]()
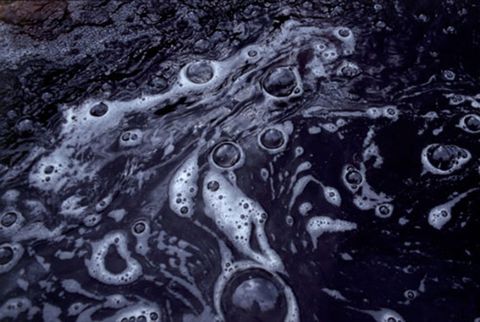
When it comes to mixing oil and water, oceans suffer from far more than an occasional devastating spill. Disasters make headlines, but hundreds of millions of gallons of oil quietly end up in the seas every year, mostly from non-accidental sources §.
The graph below shows how many millions of gallons of oil each source puts into the oceans worldwide each year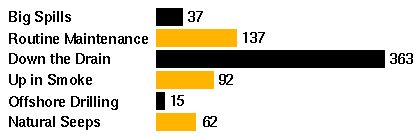
Down the Drain: 363 Million Gallons
-
- Used engine oil can end up in waterways. An average oil change uses five quarts; one change can contaminate a million gallons of fresh water. Much oil in runoff from land and municipal and industrial wastes ends up in the oceans. 363 million gallons
§Road runoff adds up
Every year oily road runoff from a city of 5 million could contain as much oil as one large tanker spill §.
Routine Maintenance: 137 Million Gallons
-
-
- Every year, bilge cleaning and other ship operations release millions of gallons of oil into navigable waters, in thousands of discharges of just a few gallons each. 137 million gallons
-
Up in Smoke: 92 Million Gallons
-
-
- Air pollution, mainly from cars and industry, places hundreds of tons of hydrocarbons into the oceans each year. Particles settle, and rain washes hydrocarbons from the air into the oceans
-
Natural Seeps: 62 Million Gallons
- Some ocean oil “pollution” is natural. Seepage from the ocean bottom and eroding sedimentary rocks releases oil.
Big Spills: 37 Million Gallons
-
-
- Only about 5 percent of oil pollution in oceans is due to major tanker accidents, but one big spill can disrupt sea and shore life for miles
-
-
- . 37 million gallons
Crude oil from a tanker that ran aground
-
- , between Staten Island and New Jersey, 1991
- photo © Michael Baytoff/Black Star
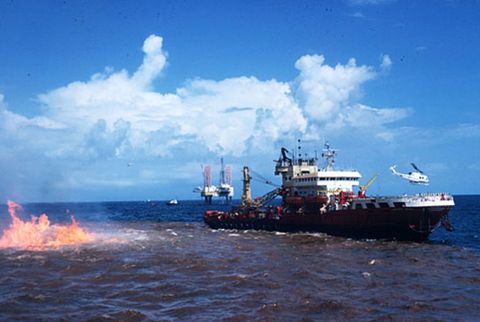
Offshore Drilling: 15 Million Gallons
-
-
- Offshore oil production can cause ocean oil pollution, from spills and operational discharges
-
![]()
Accidents
Spills and slicks sicken and kill Large spills–even though a relatively minor source of ocean oil pollution–can be devastating. The same amount of oil can do more damage in some areas than others. Coral reefs and mangroves are more sensitive to oil than sandy beaches or sea-grass beds; intertidal zones are the most sensitive. Crude oil is most likely to cause problems §.
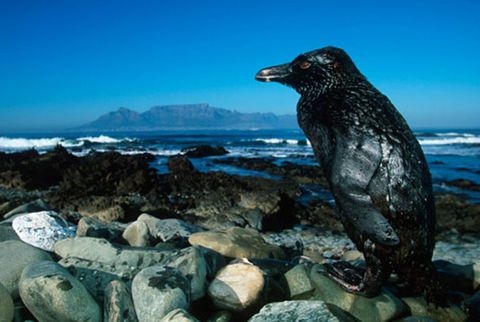
 Dead oiled otter
a victim of the Exxon Valdez spill Prince William Sound, 1989
Oil-covered fur or feathers can’t insulate marine mammals and diving birds from cold water, and when an animal cleans itself, it also swallows oil.
photo © Gary Braasch/Wheeler Pictures, Woodfin Camp & Associates
——-
 NOAA scientist collects samples from a rock sole after an oil spill, 1989
Even if oil exposure isn’t immediately lethal, it can cause long-term harm.
Bottom-dwelling fish exposed to compounds released after oil spills may develop liver disease and reproductive and growth problems.
photo Northwest Fisheries Science Center/National Oceanic and Atmospheric Administration
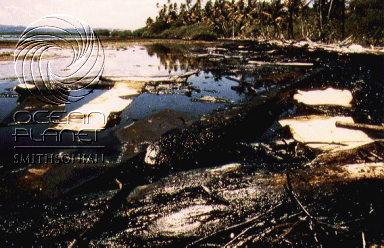
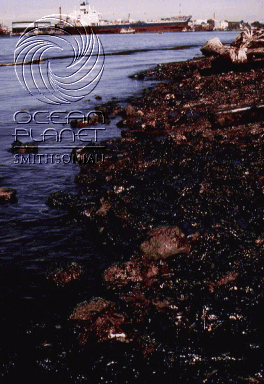
Mangroves stand in oil from a ruptured refinery tank, Panama, 1986
Smithsonian Institution scientists monitored effects of this 1986 spill, one of the largest in tropical North America. Five years later, mangrove sediments still held fairly fresh, toxic oil. It may take the mangroves fifty years to recover fully.
photo © Carl C. Hansen
![]()
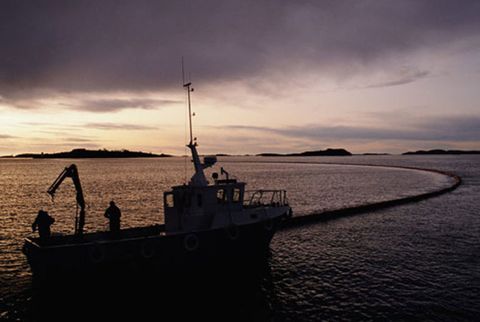
Cleanups
Treaty treats pollution problems International cooperation has greatly reduced accidental and operational oil discharges from tankers. MARPOL (for MARine POLlution) is shorthand for a United Nations treaty (the Convention for the Prevention of Pollution from Ships) that became effective in 1983. MARPOL is largely credited for reducing oil pollution from shipping by about 60 percent worldwide during the 1980s §.
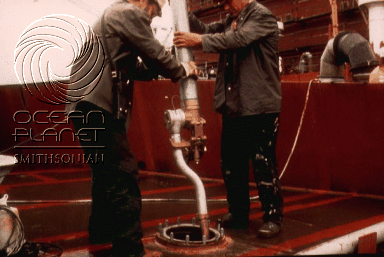
Workers install a machine for cleaning waste oil off the sides of the ship’s cargo tanks MARPOL requires installation and use of oil-pollution prevention equipment on tankers and other ships, and prohibits discharges within certain distances of land §.
photo © International Maritime Organization
More do-it-yourselfers are doing it right
More than half of all Americans change their own oil, but only about one-third of the used oil from do-it-yourself oil changes is collected and recycled. § Government and industry-sponsored oil collection and recycling programs in many communities are increasing awareness of the hazards of dumping used oil and the benefits of reusing it. §
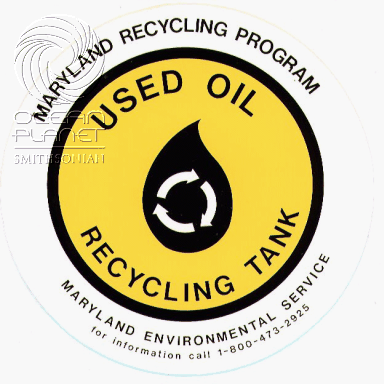
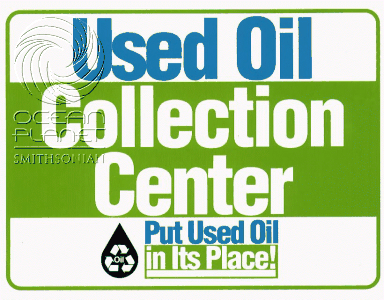
Thousands of collection centers and service stations are accepting used oil for recycling. To find out about recycling oil in your area, contact your state environmental department or local recycling authority.
Additional Information is available from:
- Oil Spill Public Information Center – provides information about the Exxon Valdez Oil Spill.
- Oil Spills – from the University of Southampton
![]()
Judith Gradwohl, Smithsonian Institution (Curator/Ocean Planet)