
TAGS: La Palma, volcanic activity, Earthquakes, Tsunami, Tsunami Travel Times, Atlantic Ocean, Pacific Ocean, Fault Lines, Flooding, Canary Islands, US East Coast, US West Coast, New Madrid Fault Line, Fracking, NOAA, NAFTA, Super Highway, Nuclear Power Plants, Dams, Geo-Magnetic Storms, CME, Electro-Magnetic Waves, Frequencies, Sound Waves, Geo Engineering, Weather Manipulation, Glaciers, Global Warming, MAPS, Edgar Cayce, Changing Earth, Rising Seas, HARRP
Take your time and take a serious look at what is laid out for you here. Let this post be a jumping off point for your own investigation. Remember, when you are researching, that you have to dig through the BULLSHIT they throw up to mislead and deceive you. DIG DEEP and ask GOD to lead you to the WHOLE TRUTH and NOTHING BUT THE TRUTH!!

With all the current volcanic and seismic activity going on in our world today, I thought it would be a good idea to present you with a visual aid that demonstrates how little time will be available to evacuate the target area if a Tsunami is detected coming toward with of our coastlines.
Interactive map of estimated tsunami travel times to coastal locations

Click here to use the tsunami travel time map
Source: National Oceanic and Atmospheric Administration
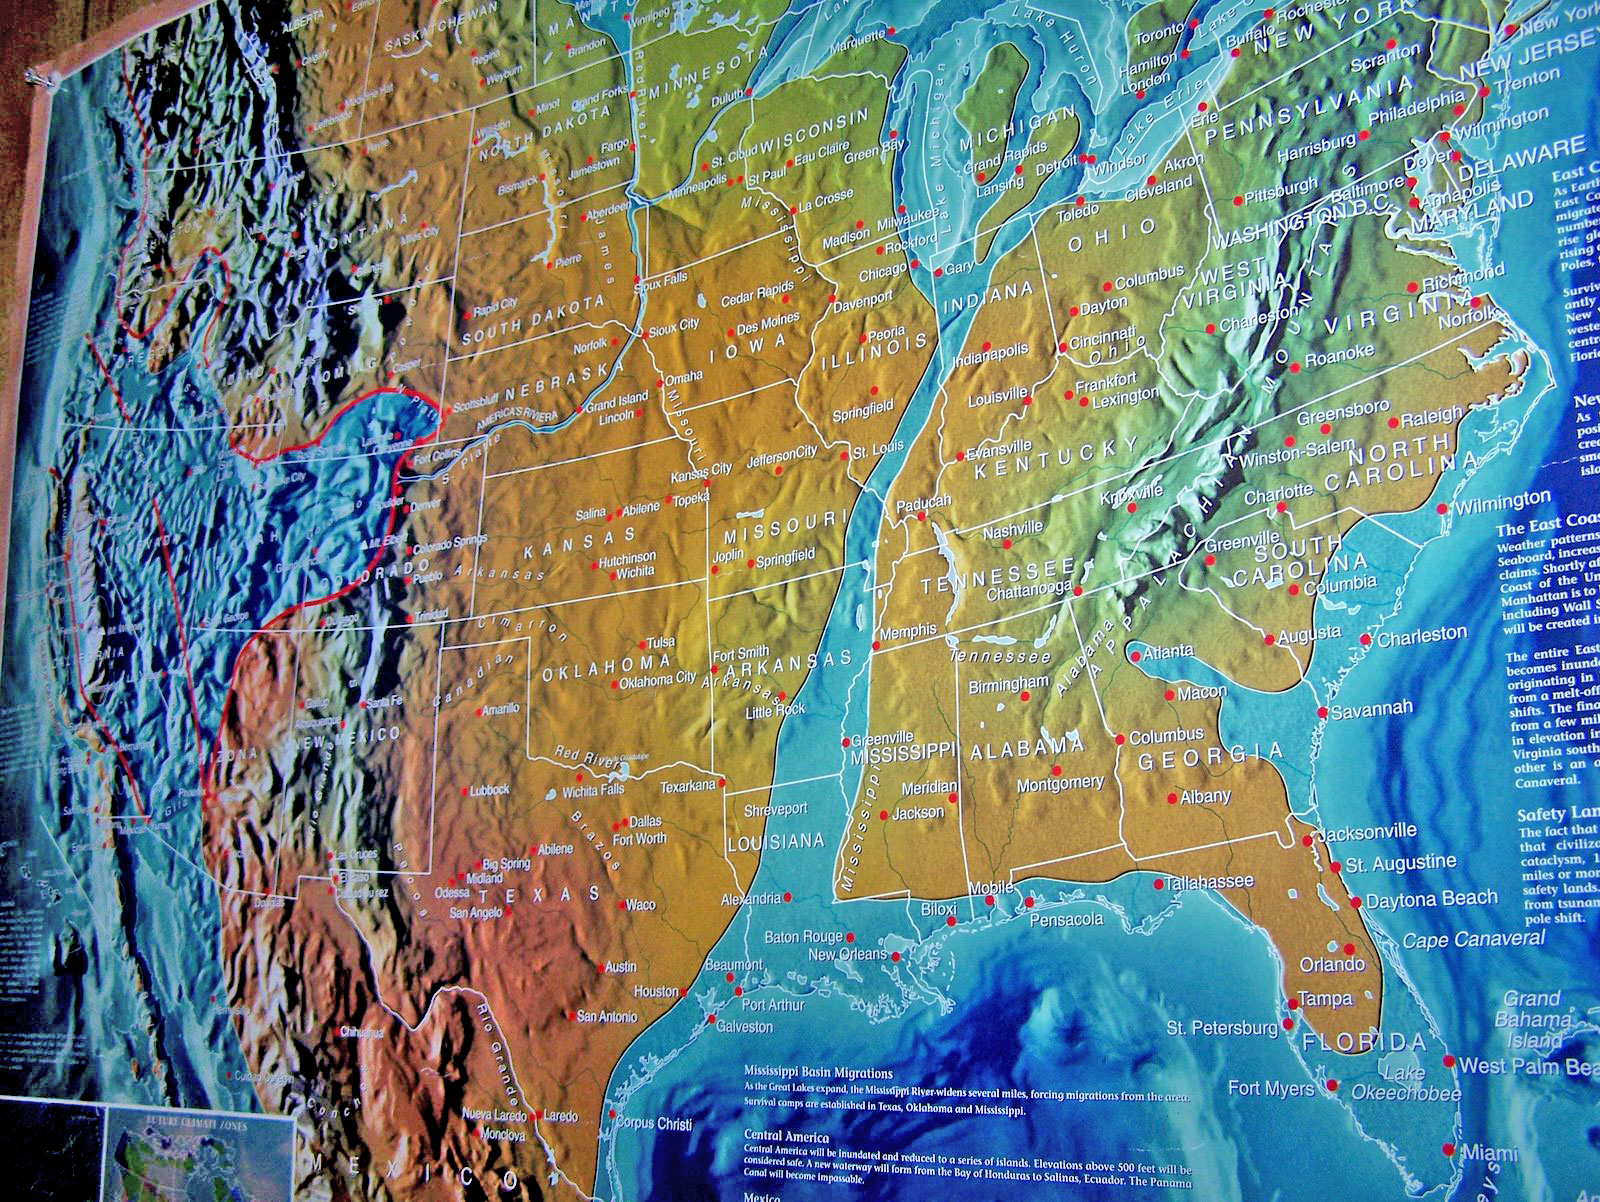
Predicted areas of US to be underwater as the seas continue to rise.
How Far Inland Can A Tsunami Travel On The East Coast USA?
 USA: Waves 130-160 ft high, traveling up to 12 miles inland – image via ZeroHedge via StanDeyo
Mithova’s Blog
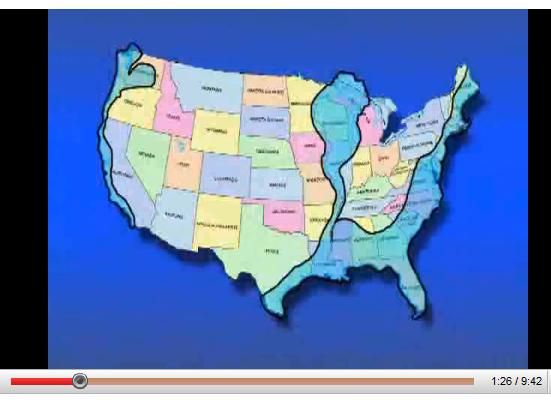
New Navy Map Of The United States Coastline
New Navy Map Of The United States Coastline – new navy map of the united states coastline, . A map is actually a symbolic depiction highlighting relationships involving components of the distance, such as objects, regions, or themes. Most maps are somewhat static, fixed to newspaper or any other durable medium, where as many others are somewhat lively or dynamic. Although most commonly used to portray maps could reflect virtually any space, literary or real, without the respect to scale or context, including in mind mapping, DNA mapping, or even computer program topology mapping. The space has been mapped can be two dimensional, like the top layer of Earth, three dimensional, for example, inside of the planet, or even maybe more abstract spaces of almost any dimension, such as for example can be found at simulating phenomena which have many different facets.
(The map below shows predicted changes in land and sea that never did occur.)

Although earliest maps known are of this heavens, geographical maps of land possess a very long heritage and exist in ancient times. The word”map” will come in the Latin Mappa mundi, where mappa meant napkin or material and mundi the whole world. Thus,”map” grew to become the shortened term referring to a two-dimensional representation with the top coating of Earth.
Street maps are possibly the most commonly used maps daily, additionally sort a sub par collection of specific maps, which also include things like aeronautical and nautical graphs, rail system maps, along side trekking and bicycling maps. With respect to quantity, the greatest assortment of accepted map sheets will be most likely assembled by local surveys, conducted by municipalities, utilities, and tax assessors, emergency services suppliers, along with different neighborhood businesses.
A number of national surveying jobs are completed from the army, such as the British Ordnance analysis: some civilian national government bureau, internationally renowned for the comprehensively detailed function. Besides position facts maps might also be utilized to depict contour lines suggesting steady worth of elevation, temperatures, rain, etc.
spacer
![]()
Sea Level Rise and Coastal Flooding Impacts
NOAA’s Sea Level Rise map viewer gives users a way to visualize community-level impacts from coastal flooding or sea level rise (up to 10 feet above average high tides). Photo simulations of how future flooding might impact local landmarks are also provided, as well as data related to water depth, connectivity, flood frequency, socio-economic vulnerability, wetland loss and migration, and mapping confidence. The viewer shows areas along the contiguous United States coast, except for the Great Lakes.
Where do these maps come from?
The maps are produced using detailed elevation maps with local and regional tidal variability.

spacer
The Plan to Divide and Conquer America at The New Madrid Fault
This chemical spraying has now wormed into movies and public places as an example for children to embrace the new normal of planes laying down a tic-tac-toe murky gloom across our skies.
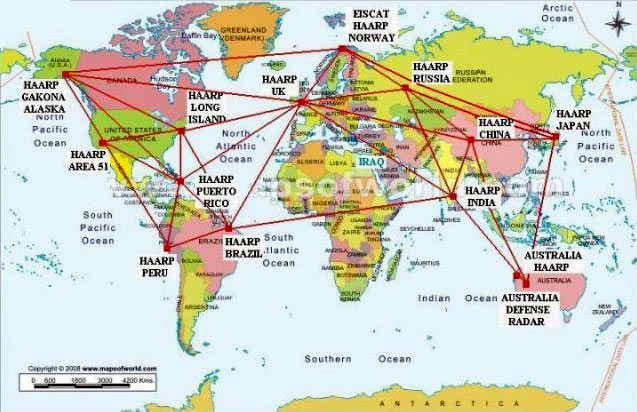
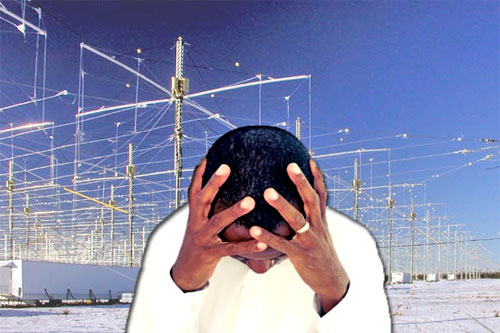
HAARP The High Frequency Active Auroral Research Program (HAARP) based in Gakona Alaska is under constant scrutiny, as researchers track its relationship to weather modification and earthquake activity. (They finally took it down because it was getting too much flack) This facility and its substations scattered throughout the U.S. have been tracked by intrepid weather researcher Dutchsinse who has made some startlingly accurate predictions based on the tell-tale radar flares of these facilities, already linked to earthquakes in the area of the New Madrid seismic zone. Subsequent flooding is so severe and unprecedented that locals are even saying it seems like the whole area is sinking. It is thought this weather manipulating technology is being tested and fine-tuned for worldwide use, as other such antenna arrays are located in Norway (EISCAT), Australia (Exmouth), and several other countries, as well as via space-based facilities. (Now, multiple countries have been using Weather Manipulation/Control for years! By their own admission and evidenced by the drastic changes in weather and weather patterns. Even corporations and corporate farms use weather control.) Benjamin Fulford is among those who claim to have spoken to insiders about specific threats made to Japan prior its 9.0 event. Video showing distinct vibrational patterns, as well as purported “punch holes” have been cited as evidence. Increased HAARP activity seems to correspond and, curiously, the HAARP site has been taken down. While the evidence that exists is somewhat tangential, HAARP’s stated capabilities are indeed ground penetrating.
Geoengineering This might be the most obvious part of the elite plan for global control: books like Ecoscience by Obama’s science czar, John Holdren the military plans for Owning The Weather by 2025 the recent Royal Society proclamations all point to a relatively small group of selected sociopaths who would love to play God with our climate, backed by ultra-elite front organizations such as the Bill & Melinda Gates Foundation As described above, there already has been a conditioning program for people to accept seeing planes spray across the skies. Now, the evidence is in: it is a chemical cocktail which contains dangerous levels of toxic particulates such as barium and aluminum. Certainly Monsanto seems to have accepted this reality, as they were quick to develop an aluminum resistant gene to insert into their GM crops. The recent mega-twister outbreak, which has led scientists to conduct a disaster autopsy, might also point to evidence of weather modification experiments that are facilitated by the presence of heavy metals in chemtrails that intensify the effect of manipulative EMFs.
HAARP and its various localized outposts and GWEN towers (Ground Wave Emergency Network) has the known capability to affect human thought.
No wonder so many are entranced by the media and the country appears to be so upset, confused, fearful and divided.
The Department of Defense even tested this Silent Sound Spread Spectrum (SSSS) technology during the first Iraq war, causing unwary battle-tested Iraqi soldiers to act like submissive children running to American troops for protection. It’s also in use in the private sector and goes by the name of Silent Subliminal Presentation System and is used as an advanced marketing technique, among other things. It is believed this technology is one of the PTBs main tools being used for the subjugation of the American people. Big Oil and Gas Fracking Since September of 2010, nearly 800 earthquakes rattled Arkansas and the New Madrid Fault Line. The entire state only experienced 38 quakes in 2009. The New Madrid Zone is believed to be a part of a complex of faults that extends down the Mississippi Valley into The Gulf of Mexico. In fact, the oil volcano that was unleashed by the BP disaster last year is thought to be at the southern tip of this volatile area. Not only are oil and gas being extracted from beneath this zone at enormous rates, but an extraction process called fracking is further exacerbating seismic activity in the region and might even trigger a mega-quake. Hydraulic fracturing (fracking) pumps water and chemicals into the ground at a pressurized rate exceeding what the bedrock can withstand, resulting in a microquake that produces rock fractures. A close look at Arkansas’ history of earthquakes and drilling reveals a shockingly noticeable surge in quake frequency following advanced drilling. Fracking is now a global technique for finding natural gas. Animal Die-offs Perhaps the most puzzling, and one of the most alarming of unnatural phenomena recently has been the sudden and unexplained animal deaths. Many factors could be at play, but the increasingly apparent weather modification effort by the powers-that-be seems to be the primary suspect. Concentrated radio beams, both HAARP and local-based, have been detected in the very regions of these die-offs. The deliberate war on nature is also displayed by GM poisoning that is now leading bees to seal off parts of their hives as a defense mechanism. (Now, most of the bees on Earth are DEAD!)
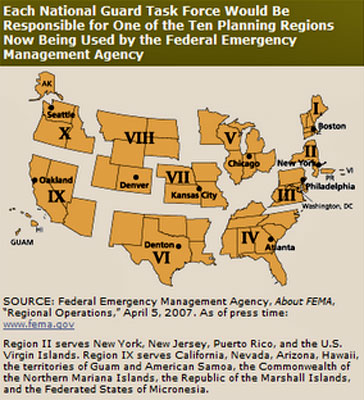
Government Preparation So, there are clearly elitists who wish to control populations en masse, and they are fully aware that much of their scientific experimentation with nature could have unintended consequences. For the eventuality of such chaos, they seem to be preparing to restore order with a rather harsh approach. Back in 2009 Shepard Ambellas brought to light a mass grave site in Phoenix, Arizona, replete with plastic coffins and FEMA camp complexes. This has now been confirmed by many independent researchers, and is a theory endorsed by ex-governor and Conspiracy Theory host, Jesse Ventura, who was shocked to learn that this isn’t a theory at all: Jesse Ventura – Police State FEMA Camps  204514:57 TO WATCH this video on BITCHUTE Click the Title Link Below: 204514:57 TO WATCH this video on BITCHUTE Click the Title Link Below: Source: https://www.invidio.us/watch?v=h6vsKMaSG1s AS EVIL AS EVIL GETS. Leave the denial at the door. This powerful episode is the largest and most in-depth investigation into FEMA camps to date— and it is scheduled to air on television. Radio host and filmmaker Alex Jones returns to the series yet again, as the team takes you to confirmed on-the-ground facilities, confronts the legislators who authorized FEMA camps and breaks down the full-scale technologically-integrated police state that includes Fusion Centers, FEMA, the Department of Homeland Security and more. At one of many real and verified FEMA locations, Jesse Ventura and Alex Jones approach a “Residential Center” run by Homeland Security in central Texas where they find locked doors, double-fences and escape warnings around the entire perimeter. Further inside the facility, they witness a playground complex, swings and slides for children. The crew walks up to the front door and attempts to get some answers. But the officials refuse to either confirm or deny the facility’s purpose, including whether or not American citizens are being held inside. However, our past investigations into this facility reveal that it has confined both children and adults, including immigrants, refugee seekers and American citizens. H. R. 645 co-sponsored Jun 10, 2010 by the following piece’s of shit: REP. STEVE COHEN [D-TN] There really is a continuity of government agenda with 10 proposed FEMA regions to be controlled by selected governors. In fact, this police state agenda is so real that outside pressure led to the episode being pulled after release, and even remotely erased from the DVRs of TiVo, Comcast, DirectTV and AT&T customers. Nothing to hide? No plans? Right. Doubters, or those who might feel comforted by the government’s version of disaster preparation, would do well to remember FEMA’s intervention following Hurricane Katrina and how horrendously that worked out for tens of thousands holed up in their stadium concentration camp where children weren’t even immune from rapes and beatings. By connecting the following dots, one should see that whether or not the chaos is deliberate, accidental, or even natural, one should think twice before entering the FEMA version of Club Med when societal collapse arrives. NLE 2011 – FEMA’s largest National Level Exercise in history has commenced. It reportedly involves over 1 million people. The states that are involved are those that already have experienced record tornado outbreaks, horrendous flooding, and consistent earthquake tremors. Now, the Army Corps of Engineers has detonated 250 tons of TNT in this fault zone to so-called mitigate flooding: JUDGE RULES OK! TO BLOW BIRD’s POINT LEVEE MISSOURI – INTENTIONAL LEVEE BLOW |
Residents are now reporting that decontamination units have been set up as part of this “exercise”.
FEMA has placed a rush order of $1 billion in dehydrated food. Homeland Security has ordered expedited printing of over 350,000 national emergency detainee handbooks.
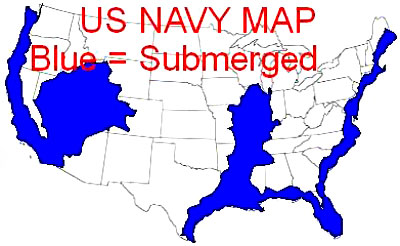
The U.S. Navy released images of the future geography of America… divided nearly down the middle.
As we consider the events that have taken place in this region over the recent past, there clearly is something major going on.
Since Katrina we have witnessed dead birds and fish, increased earthquakes, The BP Disaster, and the worst disaster since Katrina: the mega-tornado outbreak.
Regardless of the theories (and evidence) showing signs of an attempt to orchestrate a divide-and-conquer strategy for America, we would do well to prepare ourselves for an increasing number of these disasters, as well as to prepare for the official response.
Solutions: It all comes down to self-sufficiency
Once we are alert to the machinations of the elite overlords, we can then devise our own plans for preparation and eliminate the fear that they require for our subservience. The system needs dependence from the population; we must, therefore, do all we can to reduce our dependence and render our would-be controllers impotent.
Here are the 4 key areas where we can help ourselves, our families, and our neighbors break free from the elite stranglehold:
-
Economy
Of all the scams, the worldwide banking system is one of the most mind-boggling.Once you “buy into it” you’re already ensnared, and it’s either eat, or be eaten. That’s their design. Never mind the entire false premise of fiat money and the debt system – vast amounts of this illusory “currency” get shifted every micro-second in a wave of deceit and piracy.
If we are to break free of our engineered financial shackles we must develop and promote competing currencies and barter systems. They are already trying to imprison people for doing just that, which is a sure sign that it is an Achilles heel.
They can’t lock up everyone, so get started now developing your own private currency and discussing alternatives to The Federal Reserve fiat system.
-
Food and Water
This is the second main method of control the world over.Globalists use the IMF to literally use food as a weapon, which is exactly what was proposed in State Department Memorandum 200 from 1974 where Henry Kissinger addresses much of what we see happening across the globe in 2011. Food inflation already has begun in earnest, while environmental destruction is impacting food and water quality planet-wide.
By all means begin by filtering your water. And it’s never too late to learn off-the-grid methods for food production such as aquaponics and permaculture.
If you find that food growing is simply not possible, then learn where your local growers are so that you can support the strength of the community that can help you best in times of crisis.

-
Shelter and Skills
Much has been made of the massive rise in doomsday bunker purchases, as well as purchases to enter self-sustaining underground communities.This path is certainly not for everyone, as the most serious disasters could last for an indeterminate length of time. Perhaps a better path is to stay mobile, rather than fixed. It is sad that many people have lost their permanent homes during the financial collapse; however, for those in such a position you might just be best suited toward survival.
The ability to pick up and go has proven to be important as the fallout from the Fukushima disaster has circled the globe. There is always someplace safe; it is important to identify where that is and be prepared to move when necessary. Rather than “running for one’s life” as a cowardly act, this should be viewed as running toward better opportunities when presented with adversity beyond one’s control.
All true survivalism depends on one’s ability to physically adapt, then to have the mental fortitude to make the best from unfortunate circumstances. Some key areas of focus are radiation protection, plug-in scalar technology, orgonite and EMP protection.
With recent news from NASA that Comet Elenin is affecting Earth, it would be wise to also move to higher ground if possible.
-
Community
We saved the best survival tactic for last.Ironically, the pooling of resources is the single most effective and inexpensive strategy to ensure your own independence. Disaster preparation can seem like an overwhelming task to take on single-handedly – much better to befriend people who are already skilled (and well-stocked) in certain areas.
Every community already has people well-trained in mechanics, craftsmanship, food production, and tactical weapons. Rather than try the nearly impossible task of gaining skills in all of these areas, offer your current skills, property, or ideas to other key people and strategize about what-if scenarios. Just such a project has begun in New Hampshire.
The Free State Project is a recruitment for liberty-loving people to move to New Hampshire. You can read their statement of intent to decide if this might be the path for you. This is a brilliant plan for people to connect with other like-minded individuals and carry out a shared goal.
This erases the feeling of being alone, which lead so many people to inaction as they see their current neighbors turn a blind-eye to the problems we have outlined above.
We all sincerely hope that we don’t have to encounter a collapse scenario, but simple wishful thinking might not be enough; best to balance continued optimism with sound preparation.

spacer

By Brian Kahn

A new study published in Science Advances this week provides a super detailed look at local sea level rise using seemingly backwards physics and high tech models. The findings show which glaciers and ice sheets should most worry you if you live in New York vs. Sydney vs. any of the other 291 ports analyzed in the study.
The study’s breakthrough—dubbed gradient fingerprint mapping—came from “switching the point of view from someone sitting on the ice and trying to understand how ice melting locally will impact sea level everywhere in the world, to someone in a coastal city trying to understand how icy areas everywhere around the world will impact sea level rise locally,” study lead author and NASA Jet Propulsion Laboratory researcher Eric Larour told Earther in an email.
It turns out that sometimes, it’s the ice furthest away from your location that can pose the biggest problem. Take New York and Greenland. The Greenland ice sheet contains enough ice to push sea levels 20 feet higher were it all to melt. But the glaciers ringing Greenland are melting at different rates, and will continue to do so as the planet warms.

“Prolific Earth Gravity Satellites End Science Mission
All that water rushes away, and in this case it ends up on New York’s shores. The research also shows that Oslo’s sea level would actually drop if only northeast Greenland melted, a result that even caught the researchers off-guard.
“We expected to see variations in the way areas of Greenland for example affect Northern America and North Europe, but not in a way that was so spatially different!” Larour said.
The resulting analysis was spun out to include the Antarctic as well. The West Antarctic ice sheet, which could raise sea levels up to 13 feet, is already in what some researchers fear could be unstoppable collapse. The new research shows that collapse there would have a major impact on Sydney, Australia.
“The idea that our oceans are not bath tubs and ice sheet have a gravitational halo around them is simply so cool,” Robin Bell, a cryosphere researcher at Lamont-Doherty Earth Observatory, told Earther. “It is one of those things people love to learn about. This paper is the first real effort to pull apart that concept of it matters where the ice comes from.”
spacer

By Brian Kahn

The news comes in a report released Wednesday by the National Oceanic and Atmospheric Administration, which used data from 98 tidal gauges around the U.S. to make its prognosis for the 2017 meteorological year (which runs from May-April) and forecast for 2018. The findings point to an increasingly dire coastal flooding crisis.
The frequency of coastal high tide flooding—which the report defines as water levels “reaching or exceeding 0.54 meters [about 21 inches] above the long-term average daily highest tide”—has doubled in the past 30 years. And the trend is accelerating with the exclamation point coming in 2017, when there were six days of high tide flooding when averaging the number of days recorded at the 98 tide gauges.
“The underlying trend is quite clear,” William Sweet, an oceanographer at NOAA who co-authored the report, said on a call with reporters.
The city was hit by the Lake Okeechobee Hurricane in 1921. The storm set a flood record that lasted until 1934, cresting 22 inches above the high tide flood mark. Fast forward to today and reaching that record that stood more than a decade is now a common occurrence, due largely to rising seas.
“We exceeded that value four times last year,” Dusek said. “We can see how flooding that used to occur during major storms or once in a decade now occurs with regularity 4-5 times per year.”
Some cities far exceeded the average of six flood days last year. Boston set an all-time high water mark in January due to the bomb cyclone. The city saw a total of 22 days with high tide floods in 2017, setting an all-time record.
Last hurricane season also took a toll. Hurricane Irma was almost forgotten sandwiched between Harvey and Maria, but the storm was no joke. It set flood records at 15 tide gauges on its path through the Atlantic and Caribbean.
While this year’s hurricane season isn’t forecast to be as active as 2017, there are other factors that could make 2018 a nasty year for floods. Sweet noted that El Niño could emerge in the latter half of 2018. That warming of waters in the tropical Pacific can raise sea levels along the West Coast and change wind patterns in the Atlantic to create more swells and storm on the East Coast.
But it’s the backdrop of climate change that matters most. Sea levels are rising as the oceans receive more water from melting land ice and expand from rising temperatures. That means luck will run out for many coastal places lucky enough to stay dry today and when that happens, it ,” Sweet said.
spacer
The Lower Mississippi faces a risk of moderate flooding this spring, while the southwest quadrant of the country is likely to see drought conditions continue or expand. The Climate Prediction Center’s Mike Halpert provides more details of NOAA’s 2018 spring climate outlook.
Minor to moderate flood risk throughout Mississippi watershed
SPACER


2021 SPRING FLOOD OUTLOOK

![]()
This Year Has Already Been The Deadliest For Flooding Since 2017 and Another Flooding Threat Looms
By Linda Lam / 5 days ago
To Watch the Video Click the Title Link Above.

-
- More than 100 flooding deaths have occurred already this year.
- Driving in floodwaters has accounted for more than a third of the deaths so far this year.
- Heavy rainfall from Hurricane Harvey in 2017 killed 70 people in Texas.
- Now Nicholas is approaching Texas and Louisiana with potentially life-threatening rain.
This year is already the deadliest for flooding since 2017, and with another tropical cyclone expected to dump heavy rainfall along parts of the Gulf Coast this week fatalities could rise.
Flooding has killed 116 people United States so far in 2021, making it the first year since 2017 flooding fatalities topped 100.
In the past 10 years, flooding deaths have ranged from a low of 29 in 2012 to 189 and 180 in 2015 and 2017, respectively.
Hurricane Harvey was a major contributor to flood deaths in 2017, when heavy rainfall killed 70 people in Texas. In 2015, extreme rainfall led to at least 40 deaths in May in the Southern Plains, and then in October, 16 people were killed by flooding in South Carolina due to the combination of an upper low and tropical moisture from Hurricane Joaquin.
The relatively low toll in 2012 was partly due to the U.S. having an expansive drought and its

There have been a couple of notable flood events this year.
Earlier this month, the remnants of Ida combined with a front that resulted in deadly and destructive flooding in the Northeast. At least a dozen people died in flooding in New York City. Deaths were also reported in New Jersey, Pennsylvania and Connecticut.
It doesn’t take a tropical system to produce life-threatening flooding. More than 20 people died in Tennessee in August from catastrophic flooding when it rained more than 15 inches in some spots in just 24 hours.
The Southwest has also experienced deadly flash flooding. Although rainfall was welcomed after the past two generally dry monsoon seasons, the heavy rain that quickly fell at times resulted in flooding that killed more than a dozen people this year.

What To Know About Flooding
An average of 85 people are killed by flooding annually in the United States, according to NOAA (1991-2020). That’s more than the average number of deaths per year from tornadoes (69) and hurricanes (46).
Only heat claims more lives in an average year than flooding.
The deadliest time of year for flooding typically is late spring through the summer when humid air is more abundant. Thunderstorms can drop multi-inch totals quickly, especially when they persist over one area.
Tropical depressions, tropical storms and hurricanes also add to flood dangers. This week, Tropical Storm Nicholas will bring the Gulf Coast and parts of the South ample rainfall and potentially life-threatening flooding.
(MORE: Why Houston Is Likely America’s Rainfall Flooding Capital)

Turn Around, Don’t Drown
Many flooding deaths could have been avoided. That’s because 58% of the 997 fatalities blamed on flooding from 2011 to 2020 happened in vehicles, according to the National Weather Service. More than a third of the flooding deaths so far in 2021 have occurred this way.
So do not drive into floodwaters. Turn around and find another route or delay a trip. It’s hard to judge the depth of floodwater, particularly at night. Sometimes the bridge or road masked by floodwaters may have been undermined or completely washed out.
It is also important to keep in mind that conditions can change quickly over a short distance.
Here are some additional facts from FEMA to consider:
– Six inches of water will reach the bottom of most passenger cars, causing loss of control and potential stalling.
– One foot of water will float many vehicles.
– Two feet of rushing water will carry away most vehicles, including SUVs and pickups.
Once a vehicle is floating, the floodwaters become a steering wheel. If that water is moving, a vehicle could be swept away, tipped on its side or flipped. Rising water can enter a vehicle in minutes, even seconds.
The bottom line is: Turn around, don’t drown.
The Weather Company’s primary journalistic mission is to report on breaking weather news, the environment and the importance of science to our lives. This story does not necessarily represent the position of our parent company, IBM.


Future Maps Grand Delusion Map Travel Maps Tourist Attraction

True Jew News Volcanoes Tsunamis Earthquakes In Diverse Places Luke 21 11 North America Map New Madrid Poster Prints
Fault Lines In The Us This Map Shows The Major Earthquake Hazard Areas Within The United States Description From Pinterest C New Madrid North America Map Map
This map is more likely a creation based on Cayces pole shift prediction. He is predicting that the results of a pole shift of the earths magnetic field that he contends began in the mid-1930s will trigger violent hurricanes.

Americas Last Days John Moore Planet X And Earth Cataclysm Signs Map Doomsday New Madrid

Edgar Cayce New Madrid Earthquake Fault Lines Earthquake

Where To Go Polar Ice Melting Map Wars In The World Other Safe Locations Flood Map Fantasy Setting

The Photon Belt Information 93 11 Issue No 420
Notice the focused area of the storms on the map below.


Storm Could Change Course Of History New Orleans Under Water 200k Displ Edgar Cayce Predictions Cayce Edgar Cayce
 Pin On Mystiere
spacer
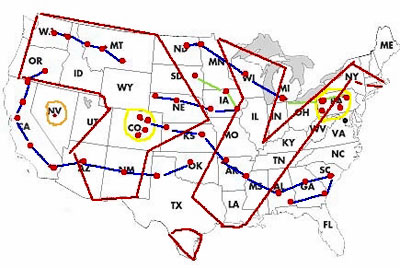
Now, let’s take a look at the Rivers across the nation. Rivers are vital to our survival. We all need water to live. Plants and animals upon which we feed all require water as well.
When the land is hit with extreme weather our rivers are impacted. As oceans rise, or waves roar and bombard the land, the impact is multiplied as the waters mix with the rivers compounding the power and force by which they devastate the land and everything and everyone on it.
June 20, 2013
By Peter Gleick and Matthew Heberger
June 26, 2013 update: Several astute readers have pointed out that the western portion of our map looked a little, well, funny. It has been decades since some rivers had flows of the magnitude shown, due to dams and diversions. Indeed, our map shows modeled runoff, which represents unimpaired flows, and does not take these developments into account. Here is a new map, where river symbols are proportional to the “gage-adjusted flow,” which takes into account real-world observations. Note the thinning of the Colorado River as it makes its way south, due to withdrawals for cities and farms. Also note the drying of some of the West’s main rivers—long stretches of the Salt, Pecos, Canadian, Rio Grande, and San Joaquin Rivers virtually disappear as their flow drops below 1,000 cfs as a result of withdrawals for human use.
How much water is there in America’s rivers, and where is it? Perhaps unsurprisingly, people have little sense of how their local water resources compare in size to other water resources. “Is that a big river? A little river?”
One of us, Peter Gleick, grew up along the Hudson River on the East Coast, and encountered rivers that seemed to be about the same size: the Susquehanna, the Delaware, the Potomac. Anyone living in the West working on water issues becomes more familiar with the Colorado, the Sacramento, the San Joaquin, and the Rio Grande rivers, but still may have little sense of how much water flows through these different river systems on any given year.
Now it is possible to visualize the nation’s water resources in different ways. At the Pacific Institute we have used a new dataset to create a scaled map of the major rivers of the contiguous 48 United States. We’re accustomed to seeing maps with what cartographers call proportional symbols: big cites get bigger dots than small ones, and interstate highways have a heavier line than county roads. In this map, rivers are scaled according to volume of water they convey. (Specifically, the width of a river segment on the map is proportional to the square root of its estimated average annual flow volume.)
Several things stand out: the massive flow of the mighty Mississippi and Columbia River systems; the paucity of major rivers in the western US, especially the southwestern US, where the only major rivers are the seriously over-tapped Colorado and Rio Grande Rivers; and the local importance of the Sacramento-San Joaquin Rivers in California, which serve the state’s cities and agricultural regions.
The data for this map come from the National Hydrography Dataset (NHDPlus v2) developed and managed by the US EPA and US Geological Survey, made available to the public and water resources community. And while we share many rivers with our neighbors, this dataset, unfortunately, stops abruptly at the Canadian and Mexican borders.
Another extraordinary map created using the same dataset was recently published by Nelson Minar, a Google software engineer. His maps show every river and stream channel identified by the National Hydrography Dataset project, including intermittent and ephemeral rivers that run dry for part or most of the year. The map is a delight to behold, but many of the blue lines represent mostly dry channels. “And you thought the U.S. had deserts!” quipped Popular Science.
Now if only you could see the Amazon, whose flow is more than ten times greater than the Mississippi. That would be more than a line on a map.
* This work is licensed under a Creative Commons Attribution-NonCommercial-ShareAlike 3.0 Unported License.

spacer
![]()
Figure 13 – uploaded by Desiree Tullos / Content may be subject to copyright.

1 Map of United States showing the number of dams in each state catalogued by the US Army Corps of Engineers (2013) National Inventory of Dams (NID). Circles (color coded by threshold of dam height) show the geographic distribution of dam removals that inform this chapter (see Table 13.1).

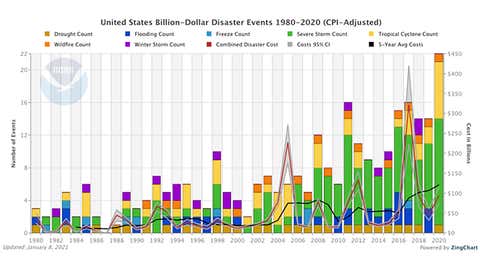
By Jonathan Erdman and Chris Dolce / January 08, 2021
Video is available on the webpage; to watch CLICK HERE

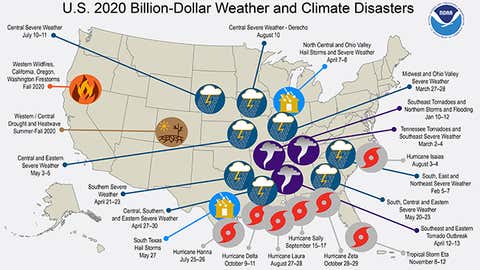
- Twenty-two billion-dollar weather disasters affected the U.S. in 2020.
- This crushed the previous record number of such disasters in any year since 1980.
- Among these were hurricanes Laura and Isaias, and the August Midwest derecho.
Twenty-two separate billion-dollar weather disasters impacted the United States in 2020, by far a record number of such events in any year, according to a report released Friday by NOAA.
The 22 disasters with damage estimates of at least $1 billion obliterated the previous record number in any year, 16 in both 2011 and 2017, in NOAA records since 1980.
All but two of the disasters occurred east of the Rockies, including seven hurricanes and tropical storms, and 13 separate severe weather events.
Only the record-breaking wildfire season and the expansive drought made the billion-dollar list out of the West in 2020.
(NOAA/NCEI)
The costliest 2020 disasters included Hurricane Laura ($19 billion), the Western wildfires ($16.5 billion) and the massive Midwest derecho ($11 billion).
The derecho, a widespread, destructive thunderstorm complex that raced 770 miles across the Midwest on Aug. 10, was the costliest single-day severe thunderstorm event to strike the U.S. since 1980.
Of the 128 severe thunderstorm events in NOAA’s billion-dollar database, only the April 2011 Super Outbreak ($12.1 billion) – a multi-day outbreak of over 300 tornadoes, including 15 rated EF4 or EF5 – was more costly than the 2020 Midwest derecho.

(NOAA/NWS/Scott Lincoln)
It was the sixth straight year with 10 or more billion-dollar disasters.
The total damage from these 22 events in 2020 – $95 billion – ranked fourth-highest in any year since 1980, behind only 2017 ($321.8 billion), 2005 ($227.6 billion) and 2012 ($133.3 billion).
Each of those costlier seasons included at least one, if not multiple, catastrophic hurricane strikes over highly-populated areas of the U.S.
(NOAA/NCEI)

6For they have shed the blood of saints and prophets, and thou hast given them blood to drink; for they are worthy. 7And I heard another out of the altar say, Even so, Lord God Almighty, true and righteous are thy judgments. 8And the fourth angel poured out his vial upon the sun; and power was given unto him to scorch men with fire. 9And men were scorched with great heat, and blasphemed the name of God, which hath power over these plagues: and they repented not to give him glory. Revelation 16
Climate Change Indicators: U.S. and Global Temperature
This indicator describes trends in average surface temperature for the United States and the world.
-


This figure shows how annual average temperatures in the contiguous 48 states have changed since 1901. Surface data come from land-based weather stations. Satellite measurements cover the lower troposphere, which is the lowest level of the Earth’s atmosphere. “UAH” and “RSS” represent two different methods of analyzing the original satellite measurements. This graph uses the 1901–2000 average as a baseline for depicting change. Choosing a different baseline period would not change the shape of the data over time.
Data source: NOAA, 20211
Web update: April 2021


How the UAE is making it rain excerpts
Is cloud seeding the answer to the UAE’s water shortages?
In AD75, Plutarch wrote that “…rain generally falls after great battles… be it that moist and heavy evaporations, steaming forth from the blood and corruption, thicken the air.” Over 17 centuries later, Napoleon used to order his artillery to fire into the skies in the belief that loud sounds and dust particles would disrupt the “atmospheric equilibrium” and surprise the enemy with a disabling deluge.
Despite the lack of proof, the Concussion Theory of Rainmaking, which arose in the wake of the French dictator’s tactics was adopted by US Congress. In 1891 it engaged retired Brigadier General Robert Dyrenforth to conduct a series of rain-making experiments in the San Antonio area of Texas. Using artillery, balloons and kites to launch explosives, his sole accomplishment was the instigation of several raging prairie fires, which promptly earned him the moniker, Dry-Henceforth.

Operation of the research facility was transferred from the United States Air Force to the University of Alaska Fairbanks on Aug. 11, 2015, allowing HAARP to continue with exploration of ionospheric phenomenology via a land-use cooperative research and development agreement.
It wasn’t until the 1940s that scientists made any real progress with creating artificial precipitation. In the US, Irving Langmuir (winner of the 1932 Nobel Prize in Chemistry) and his assistant Vincent Schaefer were researching cloud physics and ice nuclei while working at General Electric. One hot day in the summer of 1946, during experiments at Mount Washington Observatory in New Hampshire, Schaefer found that his prototype refrigerator wasn’t cold enough for the tests he wanted to run. Determined to get on with his work, he decided to speed things up and placed a lump of dry ice at the bottom of the cold box. Creating a cloud with his breath he observed a bluish haze that turned into countless microscopic ice crystals, creating a dazzling effect in the strobe-lit chamber. The sudden change in temperature had spontaneously produced ice nuclei.
On November 13, 1946, Schaefer and his pilot Curtis Talbot took off from New York’s Schenectady airport and, after a 60-mile easterly chase, scattered six pounds of dry ice in “a fleecy cloud four miles long that was floating over nearby Massachusetts,” as Time reported. “Almost at once, the cloud, which had been drifting along peacefully, begun to writhe as if in torment. White pustules rose from its surface. In five minutes the whole thing melted away, leaving a thin wraith of snow.” According to Schaefer’s lab notebook, “while still in the cloud, as we saw the glinting crystals all over, I turned to Curt and we shook hands as I said, ‘We did it!’”
One drawback, however, was that the dry ice fell too fast through the clouds and affected the water vapour inside only briefly. Another assistant of Langmuir’s, Bernard Vonnegut (who also happened to be the brother of novelist Kurt Vonnegut) solved the problem when he “seeded” clouds with silver iodide particles that would stay airborne. “Here, apparently, was a tool of almost miraculous potency,” wrote Time. Langmuir calculated that pure silver iodide was so powerful that only 200 pounds of the substance would be enough to seed Earth’s entire atmosphere (Kurt Vonnegut, who worked in General Electric’s advertising department in the early 1950s, would later fictionalise the discovery in Cat’s Cradle, where a substance called Ice-Nine instantly freezes all water on Earth).
Over half a century later, the technology has evolved but the basic principles remain unchanged: water particles collide, merge and grow. Scientists distinguish “warm” (above 0ºC) and “cold” clouds (below 0ºC) and use different seeding chemicals accordingly. With cold clouds, silver iodide and liquid propane are the most common agents, whereas warm clouds require hygroscopic salt particles — the technique used across the UAE.

Report October 2016

Number of countries doing weather modification programs increased from 52 in 2015 to 56 in 2016 and several new programs in individual countries
2016 Report WMO_ET_Weather_Modification_Research

WMO_Expert_Committee_Weather_Modification_Research-2


WMO_Expert_Committee_Weather_Modification_Research-2


Link To 2013_WMO_Expert_Committee_Weather_Modification_Research


“RAIN ON DEMAND”
BKS Energy
A Showcase for California 3/6/2015

Link To 2015-01-23 – Rain On Demand


The aerosol formation mechanism in the lower troposphere


Installation of electrical equipment for the ionization of atmospheric moisture to induce cloud creation and rainfall; Voltage: up to 100,000 Volt, 5kW power supply


spacer
I think it is noteworthy that the very areas that they are seeking to put underwater are the same areas where they have located the majority of our Nuclear Power Plants. Which can only add to the destruction of humanity, as well as the earth itself.

spacer
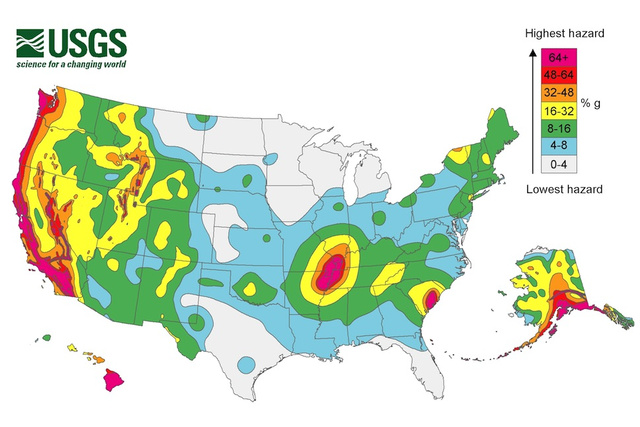
A new map reveals which parts of the US are most at risk of earthquakes in unprecedented detail – including quakes caused by people
Scientists have mapped seismic stress across North America in unprecedented detail, revealing the areas most at risk of earthquakes.
In the map below:
- Black lines indicate the direction of pressure in maximum stress areas;
- Blue areas represent extensional, or normal faulting, where the crust extends horizontally;
- Green areas represent strike-slip faulting, where the Earth slides past itself (like the San Andreas fault);
- Red areas represent reverse, or thrust faulting, where the Earth moves over itself.

- Scientists at Stanford have compiled the most detailed map to date of seismic stress across North America.
- The map and accompanying study offer precise information about the regions most at risk of earthquakes, and which types of quakes are likely to occur.
- The scientists also learned more about places in Texas and Oklahoma that are at increased risk of earthquakes due to fracking.
- Visit Business Insider’s homepage for more stories.
Zoback and his team described their mapping work in a study published Wednesday in the journal Nature Communications, calling it the first “quantitative synthesis of faulting across the entire continent.” The map and study offer detailed data about the tectonic forces at work beneath the Earth’s surface.
By incorporating nearly 2,000 “stress orientations” – measurements indicating the direction that pressure gets exerted underground in high-stress areas – as well as 300 measurements not included in previous studies, the map provides a higher-resolution picture of regional seismic activity than ever before.
To make the map, the researchers compiled new and previously published measurements from boreholes (narrow shafts drilled into the ground), then used information about past earthquakes to infer which types of faults were likely to be found in different locations.
“If you know an orientation of any fault and the state of stress nearby, you know how likely it is to fail and whether you should be concerned about it in both naturally triggered and industry-triggered earthquake scenarios,” Jens-Erik Lund Snee, a lead author of the study and postdoctoral fellow with the US Geological Survey, said in the release.
The term “Industry-triggered” earthquakes refers to seismic activity caused by humans, which is most common in parts of Oklahoma and Texas where hydraulic fracturing, or “fracking,” commonly occurs.
This method of oil and gas extraction involves injecting water deep into the Earth’s layers of rocks to force open crevices and extract the oil or gas buried inside. But it destabilizes the ground: In 2018, USGS found that Oklahoma’s earthquake threat level was roughly the same as California’s.
In the Western US, for example, the researchers observed that the direction of pressure under the Earth’s surface changed by up to 90 degrees over distances as short as 10 kilometers. That means the fluids injected into the ground in the fracking process could get pushed around in completely different ways even just a short distance from where they get injected.
![]()
Edgar Cayce Earth Changes Map
Edgar cayce prophecy maps show the geographical locations renowned psychic edgar cayce predicted would be affected by earth changes. Edgar cayce prophecy maps indicate that polar shifts and weather patterns will change the geography of the world as we know it.
In the wake of dramatic environmental changes and the nasa reports of a new asteroid interception mission shocking future maps of the world created by doomsday theorists are looking more.

Edgar cayce earth changes map. The sierras have been created because of subduction of pacific
plates under the lighter land mass and these matters are never a gentle process. These maps were not produced by cayce himself. His readings that prophesied
Association for research and enlightenment the actual readings for earth changes were relatively. Instead the prophecy maps reflect interpretations derived from his verbal readings. Edgar cayces earth changes prophecies of the more than 14000 documented psychic readings given by edgar cayce only a handful prophesied major physical changes to our planet.
Edgar cayces more than 14000 documented psychic readings contain several that prophesied major physical changes to our planet. They were put together for those seeking safety. The mountains on the west coast of the us in general will be hot and rugged with much upheaval during the shift.
Edgar cayce predicted that dramatic physical changes would affect the earth in the years 1958 1998 and would begin with the eruption of mt. Edgar cayce earth changes. His readings that prophesied these changes have spawned all kinds of speculation on future disasters and apocalyptic events however according to edgar cayces are.
The great lakes would empty into the gulf of mexico linked with a time when ancient repositories would be discovered as people reached the appropriate level of. Cyclones quakes and tsunamis. Edgar cayce coined the term earth changes a reference to a series of cataclysm events which he prophesied would take place including the earth shifting on its axis and most of california dropping into the pacific ocean following a catastrophic earthquake.
Prophet correctly predicted the stock market crash and great depression of the beginning of world war ii and many earth changes of modern times. Taken from earth changes update published in 1980 by are press. Edgar cayce prophecy maps indicate that polar shifts and weather patterns will change the geography of the world as we know it.
Edgar cayce readings regarding the pole shift. There are predictions of temperature changes in the deep waters which impact weather patterns earthquakes pole shifts and volcanic eruptions. By john van auken.
The success of edgar cayces remote healing led us to accept his other claims about the mystical nature of human life reincarnation etc. (Who are the us they reference here? Scientists?)
 The Law Of One The Golden Age Of Atlantis Shift Frequency
 Gordon Michael Scallion The Skeptic S Dictionary Skepdic Com
 Gordon Michael Scallion Crystalinks
The Shocking Doomsday Maps Of The World And The Billionaire Escape Plans
 Edgar Cayce Predictions Europe Sonic Unleashed Light Speed Shoes
 Edgar Cayce Predictions Earth Changes Rhea Coin Location Games
 Current Global Earthquake Map And Chilling Future World Forecast


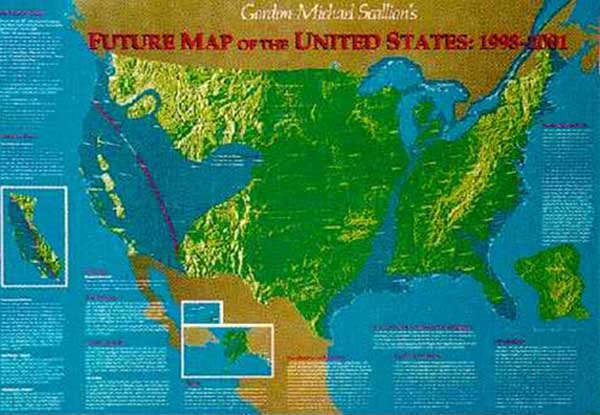
Future map of the United States by Gordon- Michael Scallion
MATRIX INSTITUTE
When I wrote my first article on billionaire bunkers years ago, I never would have imagined how quickly our world was changing. Our lives are in a constant state of flux, the political situation aside, our earth is rapidly changing. Between the increase of bizarre weather patterns hitting the earth, and recent major volcanic activity, now more than ever our focus is on our planets future.
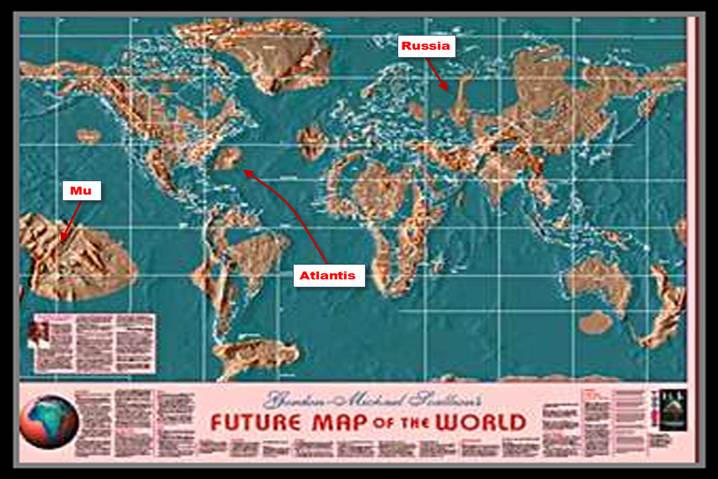
In the early 1980’s, spiritual visionaries and futurists provided clues to our changing planet. Often dismissed as crazy prophets, their thoughts for a new world were quickly ignored and laughed at. Gordon-Michael Scallion was a futurist, teacher of consciousness studies and metaphysics and a spiritual visionary. In the 80’s he claims to have had a spiritual awakening that helped him create very detailed maps of future world, all stemming from a cataclysmic pole shift. The result, while not based on any science, nonetheless provides a vivid and compelling picture of an Earth ravaged by flooding.
Scallion believed that a pole shift would stem from global warming, nuclear activity, and the misuse of technology. Another theorist and psychic Edgar Cayce predicted a 16 to 20 degree shift, while Scallion predicted a 20-45 degree shift. Cayce predicted that when both Mt. Etna volcano in Italy and Mt. Pelee in Martinique erupt together, there will be approximately 90 days to evacuate the west coast before the massive flood claims the coastline.
But the most compelling argument is that an asteroid or comet collision with earth could cause the entire planet to shift.

NASA plans to intercept Asteroid in 2021
NASA
According to a NASA report, “Many doomsday theorists have tried to take this natural geological occurrence and suggest it could lead to Earth’s destruction. But would there be any dramatic effects? The answer, from the geologic and fossil records we have from hundreds of past magnetic polarity reversals, seems to be ‘no.’ There is nothing in the millions of years of geologic record to suggest that any of the doomsday scenarios connected to a pole reversal should be taken seriously.”
“SO, we see from all the above that Psychic, Mystic, Metaphysical Swammy’s are the ones responsible for all the BULLSHIT theories that “Science” throws at us. Pole Shifts, Super Meteors, California dropping into the Ocean, Climate Change, Global Warming, they deny dumping all manner of waste into our rivers and oceans, etc… NASA calls those “theories” Natural Occurrences. Scientists and Technologists have been working hard to make all those predictions come true.”
They deny having anything to do with the cataclysmic changes to our world. They denied HARRP, they denied chemtrails, they denied man made lightning, they denied electromagnetic waves that heat our stratosphere, they deny the affects that super colliders have on our environment. When truther’s research reveals the very patents for all those things… they continue to deny. They convince the brain dead masses that people, animals and plants are destroying our environment.”
I recently spent the day at the NASA Jet Propulsion Laboratory in Pasadena where the NEOWISE Mission has become the official asteroid hunter. According to Amy Mainzer (JPL, NEOWISE principal investigator), the mission has discovered 250 new objects including 72 near-Earth objects and four new comets. They have the task of documenting potentially hazardous near-Earth objects.

JIM DOBSON
NASA has even created an Asteroid watch website with detailed listings of discovered objects as well as a detailed Impact risk chart which lists the year 2020 as the earliest increased activity risk.
During the Obama administration, plans were developed for NASA to launch a robotic probe in 2021 toward a near-Earth asteroid; the current target is a 1300-foot-wide (400 m) rock called 2008 EV5. According to John Holdren, then director of the White House’s Office of Science and Technology Policy, “After it arrives at the asteroid, the spacecraft will pluck a boulder off its surface and then fly along with the space rock for a while, investigating the potential of a deflection strategy known as the “enhanced gravity tractor.” The probe will then head back toward Earth, eventually placing the boulder in orbit around the moon. Astronauts aboard NASA’s Orion space capsule will visit the rock in the mid-2020s.
While smaller asteroids can do great damage on a local scale, experts think that space rocks must be at least 0.6 miles wide to threaten human civilization. NASA scientists estimate that they have found at least 90 percent of these enormous, near-Earth asteroids, and none of them pose a threat for the future.
I spoke with Professor Donald L. Turcotte, an expert in planetary geology at the University of California Davis, Earth and Planetary Science Department, he tells me that the predictions of earthquakes causing a planetary shift and coastal flooding is for the most part nonsense. However, he did say it is far more likely an asteroid hit would cause a polar shift. This could ultimately lead to cataclysmic change and a map similar to Scallions original vision.
With all of this knowledge of future mapping, do the world’s financial leaders know something we don’t? Consider how many of the richest families have been grabbing up massive amounts of farmland around the world. All property is far away from coastal areas, and in locations conducive to self-survival, farming and coal mining.
Bell Ranch land in New Mexico owned by billionaire John Malone
BATES LAND CONSORTIUM
It appears that dry territories in the United States such as Montana, New Mexico, Wyoming and Texas are all very popular regions for the wealthiest individuals. Billionaires such as John Malone (currently the largest landowner in America, owns 2,200,000 acres including Wyoming and Colorado), Ted Turner (2,000,000 acres in Montana, Nebraska, New Mexico and North Dakota), Philip Anschultz (434,000 acres in Wyoming), Amazon’s Jeff Bezos (400,000 acres in Texas) and Stan Kroenke (225,162 acres in Montana) all have amassed major land. Upon further research, many billionaires are preparing for future escape plans with “vacation homes” in remote locations. Many of them also have their private planes ready to depart at a moment’s notice.
Bill Gates is the biggest private owner of farmland in the US. Apr 5, 2021 Bill Gates, the Microsoft co-founder, owns 242,000 acres of farmland in the United States, making him the largest owner of private farmland.
The United States is defined by the excesses of its ruling class. But why do a handful of people own so much land? Land is power, land is wealth, and, more importantly, land is about race and class.
Billionaire Bill Gates recently acquired 28,000 acres in Arizona to create his own city called Belmont. According to the company announcement; “Belmont will create a forward-thinking community with a communication and infrastructure spine that embraces cutting-edge technology, designed around high-speed digital networks, data centers, new manufacturing technologies and distribution models, autonomous vehicles and autonomous logistics hubs.” The company details the plans including; 3,800 acres for office, commercial and retail space, 470 acres for public schools and there are plans for 80,000 residential units. “Belmont will transform a raw, blank land into a futuristic city built around a flexible infrastructure model” added Belmont Properties.
Even a wealthy member of the Mormon church, David Hall reportedly had plans for 20,000 person self-sustained communities throughout the country, including the first in Vermont with a recent 900-acre farmland purchase. The communities would have been called NewVistas, but local opposition killed the development plans.

NewVistas land in Vermont
NEWVISTAS
Internationally, moguls in Australia and New Zealand have been snapping up farmland at record paces. The interest in cattle, dairy and agricultural farms are all proving tempting for self-sustained survival. But more importantly the wealthy are preparing for safe escape havens, stockpiling real estate in dry areas and moving away from the old-school approach of storing food and water. Money and precious metals will be useless, as self sustainable territory will become the new necessary luxury. Many have installed helipads on their properties for easy access and many are buying up Silos and bunkers around the world.
spacer
MATRIX INSTITUTE


 Map of US Fault linesspacer

Link: https://indianinthemachine.wordpress.com/2011/06/13/us-navy%E2%80%99s-earth-changes-flood-map-of-america-earth-changes-maps-new-madrid-earthquake-zone-what-does-the-navy-know/
spacer
Here we present a list of the most dangerous fault lines in the USA, those known to have caused terrible damage in the past.
1. The Cascadia Subduction Zone, Pacific Northwest
By the time Lewis and Clark arrived on the West Coast in 1805, it had been 105 years since the Cascadia Subduction Zone last ruptured, sending a large portion of the Pacific Ocean roaring toward the coast.
The few remaining Native Americans in the area spoke of the earth shaking and ocean rising to consume the land. Many tribes even left the region permanently.
However, it wasn’t until the discovery of the Cascadia Fault in the 1960s that modern settlers truly understood the dangers they faced.
Running 680 miles along the Pacific Northwest coastline, the Cascadia Fault directly threatens 3 major metropolitan areas: Portland, Seattle, and Vancouver.
With Cascadia capable of producing a magnitude 9.0 earthquake, the Pacific Northwest may soon face shaking 16 times more powerful than San Francisco’s devastating 1906 earthquake, lasting 4 minutes and delivering a mighty tsunami of unimaginable proportions.
2. The New Madrid Seismic Zone, Missouri, Arkansas, Tennessee, Kentucky, Illinois
It’s not just the West Coast that needs to watch out for tectonic obliteration.
The New Madrid Seismic Zone spans southeastern Missouri, northeastern Arkansas, western Tennessee, western Kentucky, and southern Illinois. It’s the most active earthquake zone east of the Rocky Mountains.
Between 1811 and 1812, this zone experienced some of the largest quakes in history.
And although they originated in the Mississippi Valley, they rang church bells in Boston and shook New York City — over 1,000 miles away!
Even then-President James Madison and his wife Dolley reportedly felt shaking at the White House.
After one particularly large rupture in the fault, the mighty Mississippi River was forced to run backward for several hours, devastating acres of forest and creating 2 temporary waterfalls.
Fortunately the Mississippi Valley was sparsely populated back then. Today millions of people live in densely populated urban areas like St. Louis and Memphis, making this zone one of the biggest concerns for the Federal Emergency Management Agency.
3. The Ramapo Seismic Zone, Pennsylvania, New Jersey, and New York
In 1884, Brooklyn was rattled by an earthquake originating near the Ramapo Fault System.
Toppling chimneys in New York City and felt as far away as Maine and Virginia, the magnitude 5.2 earthquake was a sudden wake-up call for settlers in the region.
Running through Pennsylvania, New Jersey, and New York, the Ramapo has remained quiet for about 200 years.
While studies have shown that a quake greater than 5.0 to 5.5 in magnitude is unlikely, urbanization in the tristate region leaves the area extremely vulnerable.
A mid-magnitude earthquake in the right place could cause devastating damage.
One of the faults in the Ramapo system even crosses New York City around 125th Street.
A magnitude 5.0 rupture lasting more than a minute or 2 could cause intense structural damage to numerous Manhattan skyscrapers, most of which are not designed to withstand such tectonic activity.
4. The Hayward Fault, California
This very unstable fault in California has been threatening the San Francisco Bay Area for generations.
It’s capable of producing quakes ranging from 7.0 to 8.0 in magnitude.
The last major movement along the Hayward Fault occurred on October 21, 1868, virtually destroying downtown Hayward.
In fact, it was considered the “great earthquake” until the San Andreas Fault tore San Francisco apart 38 years later.
Running for nearly 74 miles through cities including Fremont, Hayward, Oakland, Berkeley, and Richmond, the Hayward Fault has the potential to wreak more havoc than most California faults.
Over 2.4 million people live within close proximity to the fault today, not to mention the key infrastructure developments, including a major public transit system and the Caldecott Tunnel that run precariously through the fault.
5. The Denali Fault System, Alaska
If we’re talking sheer magnitude, the largest recorded earthquake on North American soil hit Alaska on November 3, 2002.
Starting on the Susitna Glacier Thrust Fault, the rupture raced along the Denali Fault System and continued 220 kilometers until it reached the Totschunda Fault, rattling 70 more kilometers.
Here a video about the 1964 Alaskan earthquake, also known as the Great Alaskan earthquake and Good Friday earthquake, which occurred at 5:36 PM AST on Good Friday, March 27, 1964.
The estimated magnitude of this earthquake ranged from 7.0 to 7.9 with a surface wave magnitude of close to 8.5.
This almighty quake caused extensive damage to the transportation systems in central Alaska.
Multiple landslides and rock avalanches occurred in the Alaska Range and Black Rapids Glacier. This event was literally felt across the nation, even causing waves in pools and lakes in Texas and Louisiana!
6. San Andreas Fault, California
California sits at the border between two major tectonic plates — the Pacific plate, which is moving northwest, and the North American plate, which is sliding past it to the southeast.
The two plates don’t just meet at a single line, and the state is crisscrossed with dozens of earthquake faults.
The San Andreas is the most worrisome, because it generates the quakes that are really dangerous to California residents.
The fault indeed slices California in two from Cape Mendocino to the Mexican border. San Diego, Los Angeles and Big Sur are on the Pacific Plate. San Francisco, Sacramento and the Sierra Nevada are on the North American Plate.
While San Andreas does not go through San Francisco, it crosses Desert Hot Springs, San Bernardino, Wrightwood, Palmdale, Gorman, Frazier Park, Daly City, Point Reyes Station and Bodega Bay, (or just a few other million people).
The northern San Andreas leveled San Francisco in 1906, but it’s been a lot longer since the southern part of the fault ruptured.
On average, Southern California has seen big quakes every 110 to 140 years, based on records of past earthquakes and studies of earthquake faults.
The last big quake near Los Angeles, a magnitude 7.9, struck Fort Tejon in 1857. Farther south, near Palm Springs, the fault hasn’t ruptured in over 300 years. The fault has to break.
If you live near one of those dangerous faults in the USA, I would rather have a plan ready for surviving the next ‘Big One.’ Get prepared and be ready! [ESurance]

OK, this is probably going to be controversial, and I am probably going to end up looking silly, but I feel the need to get it out in the public eye… so here goes. ATS is the most open forum to possibilities on the Internet.
Many of you know me. I am not a geology guru, but I am pretty good in the engineering disciplines. When I look at a map of the globe, I see forces and counter-forces. I recently was looking over this thread concerning a small but unusual earthquake in northern central Indiana and remembered a prediction I had quietly made to myself a few months ago. I actually was concerned about an earthquake happening in this area.
Now obviously, I didn’t record that prediction, so I am going over this from square one. It starts with the recent BP Gulf Oil disaster.
This is a map I pulled up from Google Maps, on which I superimposed the plate boundaries/faults in red, the forces acting on/from these faults in yellow, and the location of the BP well in green (I don’t have Photoshop on this machine, it’s still too cold to go to the shop, so forgive my poor skills with inferior software):

The Pacific plate we are all pretty familiar with. It is exerting a small pressure on the American West Coast up to Alaska. There is a small sideways fault in it that ends in northern California, evidence that the tectonic movement is changing either speed or direction along that line. Based on the shape of the Pacific Plate where it interacts with Alaska, I would expect a directional shift northward north of that line and due east south of it.
The small Central American Plate is also pretty familiar to anyone who has looked at fault lines. It appears to me to be pretty dense and immobile, causing islands to pile up around its edge. That would explain why it broke loose into its own plate.
Of course, to the right you will see the Mid-Atlantic Rift, where the plates are pulling apart from each other. What initially got my interest was the shift just east of the St. Lawrence Bay… it looks as though here again, the plate is cracked but this time by a speed shift… as though the plate to the south is moving faster than the one to the north. If you follow this geographic feature, it aligns perfectly with the St. Lawrence River, which is itself something a bit unusual simply due to its size… the river is huge, almost like a gash that happens to be filled with water. Follow this river down and it ends in the Great Lakes, Lake Erie to be precise, and seems to disappear.
Now look at the New Madrid Fault. It extends down the Mississippi River into the Gulf of Mexico, although it is inactive for the most part south of New Madrid. It stops right about the same spot where BP drilled that infamous well.
Putting all this together, I see two plates tightly locked making up the North American continent, not one. The boundary is a line that extends from the Gulf to New Madrid, disappears, then reappears in the Great Lakes and goes up the St. Lawrence. It’s like what happens with glass under the right amount of pressure; cracks will form, but sometimes will not connect immediately. The glass stays whole, despite it being cracked, because one section has not completely broken off yet. That is the pattern I am seeing here. The Midwest, Illinois, Indiana, Ohio, are the only thing holding this North American Plate together.
Now, what happened when the well erupted? For a month or more, it was gushing liquid and gas out at an amazing 70,000 psi! I believe that pressure relief caused a chain reaction to begin:
- When the pressure was released, it was no longer opposing the forces that travel down the New Madrid Fault.
- This could have been sufficient to cause the eastern and western portions of the North American Plate to try and re-distribute the forces along them, resulting in an increase in shearing force.
- Just like a crack in glass will grow if the shearing force increases, so too could this cause the New Madrid Fault to start slowly extending into the Midwest
- Evidence of this extension would be expected to be earthquakes in the Midwest of moderate magnitude at first, increasing in frequency and intensity as the crack grows.
- If the crack bridges the gap between New Madrid and Lake Erie, it will allow the two plate sections to actually slip, causing a more severe earthquake.
- This could easily cause the fault to open along the Mississippi, turning it into an inlet rather than a river, as has been prophesied by several people, including Edgar Casey (see below).
- Also in line with those prophesies, this same situation could drop the ground level around the Great Lakes (large enough to mark a weakness in the crust) and turn that area into one super-Great Lake.
- This will also mark a decrease in pressure on the eastern side of the western section of the North American Plate.
- This will cause the western North American Plate to shift as the pressure from the Pacific Plate is no longer balanced by pressure from the Mid-Atlantic Rift.
- This shift would cause a massive Californian earthquake as the plates re-balance their forces.
Now please bear in mind I am not making any date predictions here. I honestly have no idea if this could happen in hours, days, weeks, months, years, decades, or at all really. I am throwing it out as a possibility that appears probable to me.
I am including the future maps I mentioned in this post. This one is by Edgar Cayce:
Source: www.disclose.tv…
And this one is by Gordon Michael Scallion:
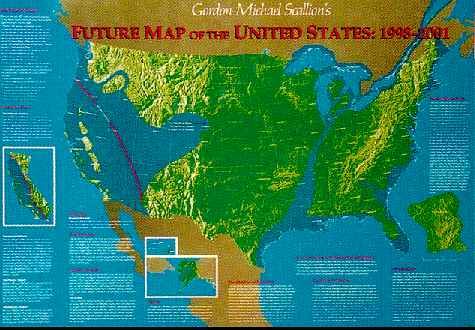
Source: www.fortunecity.com…
Now all this is just me trying to make sense of the forces I am seeing and the reports I am hearing, and I am seeing/hearing eerie correlations to the prophesies I referenced above. I am sure there are plenty of posters on ATS who are much more knowledgeable about tectonics than I, and I am sure they will read this. Please, by all means, if you see a logical error in my thinking, point it out! All I ask is that you point it out logically and with some backup… if someone just says “I don’t think you’re right”, that does no one any good. Tell me why I’m not right! What am I missing?
I really, really don’t want to be right…
TheRedneck
Some time back, I posted a thread entitled Cracking an eggshell? that addressed the rumblings going on along the New Madrid/St. Lawrence fault lines. But the recent rumblings along Canada’s West Coast have provoked me to focus my attention on a different area.
In that older thread, I showed the pressure directions as shown in this original picture:
As you can see, the pressure lines run from east to west across the North American continent. Now I want to focus on the Pacific Basin, at least the northern half of it:
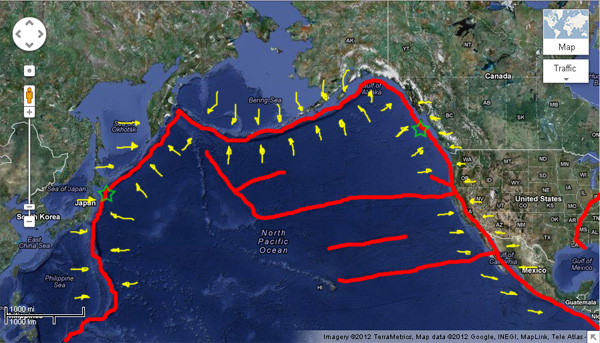
This is another image I made along the same lines showing the Pacific Basin. The Fukushima quake and the Vancouver quake are shown with green stars, the fault lines are shown in red, and the pressure directions (approximate since I don’t have perfectly steady hands) are shown in yellow. What caught my eye was the bulge along the Bering Island Chain… indicative of a flow. Rocks do flow under pressure, even if they are ‘solid’. The bulge is the result of the interaction of the Asian Plate and the North American Plate pressing toward each other. The rock has to go somewhere, so it begins to flow southward like an extremely viscous liquid. This in turn transmutes the east-west forces into a southerly force that is pressing against the northern edge of the Pacific Basin.
This puts pressure on the northern part of the Pacific Plate. Notice how smooth the upper part of that plate is compared to around the California/Hawaii area. Off the coast of California, the plate is cracked and fractured, while north of California it is more solid and unbroken. Rocks come in all different hardnesses and brittleness, so this is not really unexpected, but it does indicate a unique situation in this area. Both the Fukushima and Vancouver quakes were the result of plates building stress against a relatively hard Pacific Plate section. Compare that to California, with smaller but more frequent rumblings, the result of a more easily deformed area of the Pacific Basin.
What does this hold for the future? Well, simply put, the stresses are shifting. The Vancouver quake released energy in that area; that will in turn apply pressure to the cracked area below it (California). this pressure can release in one of three ways:
- The rock can deform to accept it. Unlikely, since the broken faults extending from California into the Pacific indicate this rock is not very good at deforming, since it is brittle and therefore much better at cracking.
- There will be an increase in quakes along California. This one is quite probable, as the rock adjusts to its new force equilibrium. It is also desirable, because the third option is much worse.
- The increased pressure on the California coast will decrease the number of small-medium quakes in the coming months. This is the scariest possibility, because it means pressures will begin to build instead of being released regularly. Building pressures will create larger quakes as the rock finally slips, and o course there is no way to know i the rock, as brittle and cracked as it is, will simply slip suddenly and tragically, or will literally crumble away.Crumbling away is a bad thing. Trust me on this.
There are other considerations. The New Madrid will now have pressure increased from the West, as the pressures from California are transmitted throughout the crust. This increases the likelihood of a slip, and a slip of enough intensity would break the Midwest tie I mentioned in the earlier thread. That means be on the lookout for those tell-tale shakes along the Illinois/Indiana region. Tremors north or south (Quebec, Arkansas) could be precursors to this.
Also, this would result in a pressure shift on Yellowstone. While I could not suggest a result of the New Madrid situation on Yellowstone, I do believe this would result in either a reduction of pressure keeping Yellowstone in check, or a sideways pressure that could easily open a fissure in the area. No, the planet is not going to crack apart, but even a small fissure (crack) could lead to some fireworks in the area.
In short, I suggest anyone interested in this line of thought be on the lookout for the following:
- Small earthquakes in the Midwest from New Madrid to Chicago.
- Changes in the Yellowstone cauldera.
- Either increased or decreased activity in California. Increased=good, decreased=worry.
TheRedneck
spacer
![]()
Fukushima in America?
Twelve nuclear power plants are in the path of Hurricane Florence… flooding, storm surge threaten cooling operations
by Mike Adams
(Natural News) At least twelve operating nuclear reactors are in the predicted path of Hurricane Florence, which has been upgraded to a category 4 storm as it surges toward the U.S. East Coast. According to the U.S. Nuclear Regulatory Commission, which offers an interactive map of active nuclear reactors, two plants are vulnerable to both heavy rainfall and the expected storm surge which could bring a surge of up to 20 feet of ocean water pouring into coastal areas.
Those two reactors, located NE of Myrtle Beach, North Carolina, are known as “Brunswick Steam Electric Plant, Unit 1” and “Brunswick Steam Electric Plant, Unit 1.”
Each unit produces nearly 1,000 MWe of electricity, and they are both built on the General Electric “Type 4” power plant design, which is almost identical to the GE nuclear power plant design used in the Fukushima-Daiichi reactors in Japan. All of these reactors are designed and constructed as “boiling-water reactors” or BWRs. The designs are decades old, and they are subject to catastrophic failures and even core meltdowns that release radioactive isotopes directly into the atmosphere and surrounding areas.
![]()
According to current forecasts, these nuclear power plants appear to be in the direct line of Hurricane Florence. Here’s the current forecast from the NOAA, which brings the hurricane directly into North Carolina’s coastline:


The Brunswick plant is a “Boiling Water Reactor” just like Fukushima
As this link from the U.S. NRC shows, the Brunswick Steam Electric Plant, Unit 1 is also a “Boiling Water Reactor.” It was originally authorized for operation in 1976 and it licensed to continue operating through 2036. The following diagram shows how BWRs operate, using heat from the nuclear reactions to turn water into steam that drives steam turbines which generate electricity:
Get CLEAN FOOD and help support our mission to keep you informed: The Health Ranger Store lab verifies everything we sell with accredited testing for heavy metals, microbiology and food safety. Certified organic facility, ISO-accredited on-site laboratory, no GMOs or synthetic ingredients. The world’s #1 source of lab-verified clean foods and superfoods for nutritional healing. 600+ products available. Explore now.

Boiling Water Reactor plants must sit at low elevation near rivers or lakes in order to have access to cooling water
BWR nuclear power plants rely on cooling designs that use large bodies of local water (rivers or lakes) to transfer heat from the nuclear power plant to the atmosphere. This heat transfer is necessary to prevent nuclear fuel rods from overheating and melting down in a runaway nuclear reaction. Importantly, this cooling operation relies on electricity to run the cooling pumps that circulate the water.
For this reason, U.S. nuclear power plants are equipped with multiple redundant cooling systems and backup generators that can run the pumps even if the local power grid is cut off. At the Fukushima-Daiichi nuclear power facility, both backup diesel generators and battery power systems were present.
You might wonder, then, how the electricity failed on all accounts, causing the cooling pumps to stop operating, ultimately leading to “criticality” of the fuel rods — i.e. a meltdown. (For the record, the entire U.S. media lied about the Fukushima meltdown, claiming no meltdown had occurred. Only now, years later, does the media admit a nuclear meltdown took place. But in their original reporting, they universally claimed there was no meltdown. Just another example of how the media relentlessly lies about everything, not just politics.)
The answer is found in the storm surge — a massive wave of ocean water that swept through the Fukushima facility, drowning the diesel generators, coolant pumps and backup batteries. In effect, Fukushima was inundated with ocean water, and everything stopped functioning. But the physics of the fuel rods was still operating, and you can’t stop fission reactions just by hoping and wishing. So the fuel rods melted down and a nuclear meltdown took place, producing the Fukushima catastrophe we’re all still suffering under today.
As the Nuclear Regulatory Commission explains on this page:
The reactor’s core contains fuel assemblies that are cooled by water circulated using electrically powered pumps. These pumps and other operating systems in the plant receive their power from the electrical grid. If offsite power is lost, emergency cooling water is supplied by other pumps, which can be powered by onsite diesel generators. Other safety systems, such as the containment cooling system, also need electric power. BWRs contain between 370-800 fuel assemblies.
What the NRC doesn’t explain, however, is what happens when all the electrical power and backup generators fail.
See my full threat analysis and preparedness wisdom in this REAL.video exclusive video:
The Brunswick power plant sits at a very low elevation, near the ocean
The concern among observers today is that the Brunswick Steam Electric Plant sits at a very low elevation in Southport, NC, just a few feet above sea level. The power plant sits directly on Cape Fear River, which was artificially modified to be used by the nuclear power facility so that coolant water could be drained into the ocean, just to the East. (Notably, Archer Daniels Midland also sits about half a mile away from this facility.)
To the East of the Brunswick power plant is Zeke’s Island, a thin barrier between the Brunswick power plant and the Atlantic Ocean. Zeke’s Island will of course be instantly under water if the expected 20′ ocean surge achieves a direct hit on this area.
![]()
A 20′ ocean surge would, without question, threaten the Brunswick nuclear power plant. To what extent, we can’t say. Presumably, highly qualified technicians are preparing the power plant for the coming hurricane. Then again, Fukushima was also run by highly qualified technicians and really smart nuclear engineers who claimed a meltdown could never possibly take place. Take all official assurances with a healthy dose of skepticism (and perhaps a dosimeter as well).

Nuclear meltdowns release radioactive Iodine-131
What’s the big deal about nuclear power plants melting down and release radioisotopes into the atmosphere? The problem is found in the toxic mix of radioisotopes released in such catastrophes. Various isotopes are released, most notably including Iodine-131 and Cesium-137 (along with some other isotopes of uranium and plutonium, depending on the elemental composition of the fuel used).
Iodine-131 and Cesium-137 are extremely dangerous because of their relatively short half lives. In the realm of physics, a shorter half-life means the element is giving off radiation more quickly, releasing more energy into surrounding ecosystems or organisms (which could include you). In fact, the safer radioisotopes are those with very long half-lives, since they release relatively little radiation in any given time period.
Iodine-131 has a half-life of roughly 8 days. For purposes of simplifying things, we’ll call it a week.
Cesium-137 has a half-life of roughly 30 years.
Note: As a matter of establishing some qualifications here, I’ll remind readers that I’m the patent holder of a patent called Cesium Eliminator, a dietary supplement that was approved by the U.S. Patent and Trademark Office in 2014. You can read the patent here.
You can read about the invention, how it works, and the lab tests proving its efficacy at this link:
Cesium Eliminator is not for sale to the public. I am stockpiling the ingredients for Cesium Eliminator in Texas, where I have around 10,000Kg of the raw materials, ready to manufacture. I will only offer it (or donate it) to organizations when needed in a nuclear emergency.
I developed Cesium Eliminator as a way to remove cesium-137 from the digestive tract so that people who drink cesium-contaminated water or eat cesium-contaminated food can have a safe, effective way to eliminate cesium from their bodies. This avoids having the cesium absorbed into the bloodstream, where it circulates to internal tissues and irradiates the body from the inside, causing cancer, immunosuppression or death.
As the U.S. EPA testifies on its own website:
Cesium-137 that is dispersed in the environment, like that from atmospheric testing, is impossible to avoid… People may ingest cesium-137 with food and water, or may inhale it as dust. Like all radionuclides, exposure to radiation from cesium-137 results in increased risk of cancer.
It takes ten half-lives for radioisotopes to fall to a “zero”
Here’s what you need to remember in all this: It takes about ten half-lives for radiation to fall to a level considered “zero.”
For Iodine-131, that means 10 weeks. Here’s how the physics works, roughly speaking:
Week 1: You’re exposed to the FULL DOSE of Iodine-131 radiation
Week 2: You’re exposed to 1/2 the dose
Week 3: You’re exposed to 1/4 the dose
Week 4: You’re exposed to 1/8 the dose
… and so on.
Iodine-131, of course, gets absorbed into the body through food and beverages (including cow’s milk), where it tends to accumulate in the thyroid gland. This causes the irradiation of the thyroid gland from the inside, essentially “burning out” this gland, leading to lifelong health problems that can include cancer and death.
For this reason, U.S. government officials strongly encourage people to have supplementary Iodine available as a dietary supplement. When iodine is consumed as a supplement, the non-radioactive iodine elements are deposited onto the thyroid gland, “locking up” all the iodine receptor sites there (plus covering other iodine-ready organs such as breast tissue and prostate tissue), causing radioactive iodine to have nowhere left to go except to leave the body through normal elimination.
Thus, when people take supplementary iodine, they may prevent radioactive iodine from lodging in their body. This reduces total exposure time to the radioactive iodine, since it is naturally eliminated from the body over time. (Iodine and other elements have something called a “blood half life” which means how long it takes the body to eliminate them from circulating blood. Do not confuse this with the “physics half life” which refers to the transmutation of elemental mass into energy, over time.)
Where to get iodine at honest, normal prices, with no price gouging
For purposes of public safety, I’m going to list both the Health Ranger Store iodine and the InfoWars Store iodine products, which are offered at normal, everyday prices with no price gouging. Anyone wanting to have supplemental iodine on hand should immediately seek out these or other sources for supplemental iodine:
Health Ranger Store nascent iodine Preparedness Pack
Global Healing Center Detoxadine (Nascent Atomic Iodine)
FDA-approved ioSAT Potassium Iodide Tablets
InfoWars Store Iodine: Survival Shield X-2 Nascent Iodine
Note that nearly all of these are on sale at the moment, and probably all will be completely sold out due to the Hurricane Florence approaching disaster. If you need iodine immediately and can’t wait for shipping from an e-commerce provider, you may still be able to go to your local health food store and purchase elemental iodine as a dietary supplement.
SAFETY ALERT: You cannot drink povidone iodine (the first aid topical liquid). It is toxic to swallow. However, many preppers believe that if you apply this solution topically, your body will absorb the elemental iodine through the skin, raising your blood iodine levels. This makes sense to me, but I have not personally tested this, so I can’t vouch for it.
LAST-DITCH TIP: If you still cannot find any sources of iodine, you can eat large amounts of seaweed which also contain iodine from ocean water. I cannot recommend how much to eat: You should check with your physician or naturopath for that answer.
Bottom line: If the Brunswick nuclear power plant goes “Fukushima,” it’s over for the East Coast
It probably goes without saying, but if the Brunswick nuclear power plant goes into a meltdown, the entire U.S. East Coast would suffer unprecedented radiological contamination and disaster. This includes Washington D.C., Virginia, New York and perhaps even Boston, depending on wind speed and direction.
Obviously, we all pray this never happens, but we also know that nuclear industry “officials” are incompetent liars who routinely lie about everything, including nuke plant safety. Here’s a photo of the Fukushima explosion (a hydrogen explosion) which the nuclear industry — and General Electric officials — swore could never happen:
![]()
Now imagine that on the U.S. East Coast. This is the scenario we’re all concerned might happen if all the wrong events converge.
My advice? Stay prepared. Evacuate the area if you can. Get some iodine just in case, and have stored food, water filters and other obvious emergency supplies at the ready.
Prepare for the worst and pray for the best. With a little luck, we’ll all get through this and things will return to normal after the storm passes.
Proudly powered by WordPress. Theme: Bushwick by James Dinsdale.